Letter from Executive Chairman and CEO
Pat Ryan — Executive Chairman
It is our privilege to present Ryan Specialty's 2025 Annual Report.

Overall, 2025 was a strong year for Ryan Specialty, particularly
considering the significant headwinds the industry faced. We surpassed
revenues of $3 billion, up 21% year-over-year, and delivered our 15th
consecutive year of double-digit organic revenue growth and our seventh
consecutive year of growing total revenue by over 20%. This was one of
the most volatile and reactive environments I’ve seen across my more
than 60 years in the industry. Achieving these results at a time of
challenging market conditions is an incredible testament to the resilience
of our platform, the quality of our people, and the intentional
diversification we’ve built over the past 15 years.
We built Ryan Specialty to excel through transitioning markets, not just for the easy years. Diversified
specialties, diversified products, and diversified earnings, all backed by world-class talent, all by
design. From the very beginning, we made a deliberate decision to build more than a wholesale
broker and invested heavily in delegated authority. Over the last two years, we have doubled our
delegated authority revenue to $1.4 billion, now representing 47% of our total revenue. We grew the
number of products on our platform by 50% to over 300, expanded our international presence to 24
offices, and invested nearly $2.7 billion across 12 acquisitions. The diversification we have achieved
is significant, and we believe positions us well for a wide range of market outcomes.
As the coach of this terrific team, I am incredibly proud of our entire team’s efforts to navigate such a
dynamic environment. Through the expertise, depth, and determination of our people, we will
continue to provide differentiated value for our brokers, agents, and insurance carrier trading partners.
We believe that all of these efforts will drive significant additional value for our stockholders and
ensure we remain the leading specialty insurance services firm in our industry.
Tim Turner — CEO

Ryan Specialty once again set the standard for the specialty insurance
industry in 2025, delivering our 15th consecutive year of double-digit
organic growth in a year where there were significant pressures across
the insurance broker landscape. I am incredibly proud of how our team
navigated what was, without question, the most challenging property
environment the insurance industry has faced in decades. We capitalized
on specific areas of accelerated growth, launched innovative solutions
like Ryan Re’s expanded relationship with Nationwide, RAC Re, our first-
of-its-kind multiline collateralized sidecar, and numerous real-time de
novo formations to meet the emerging needs of the market. As you’ve
seen us do repeatedly, when we see an opportunity, we organize, and
we move at the speed our clients and trading partners demand.
Achievements for 2025
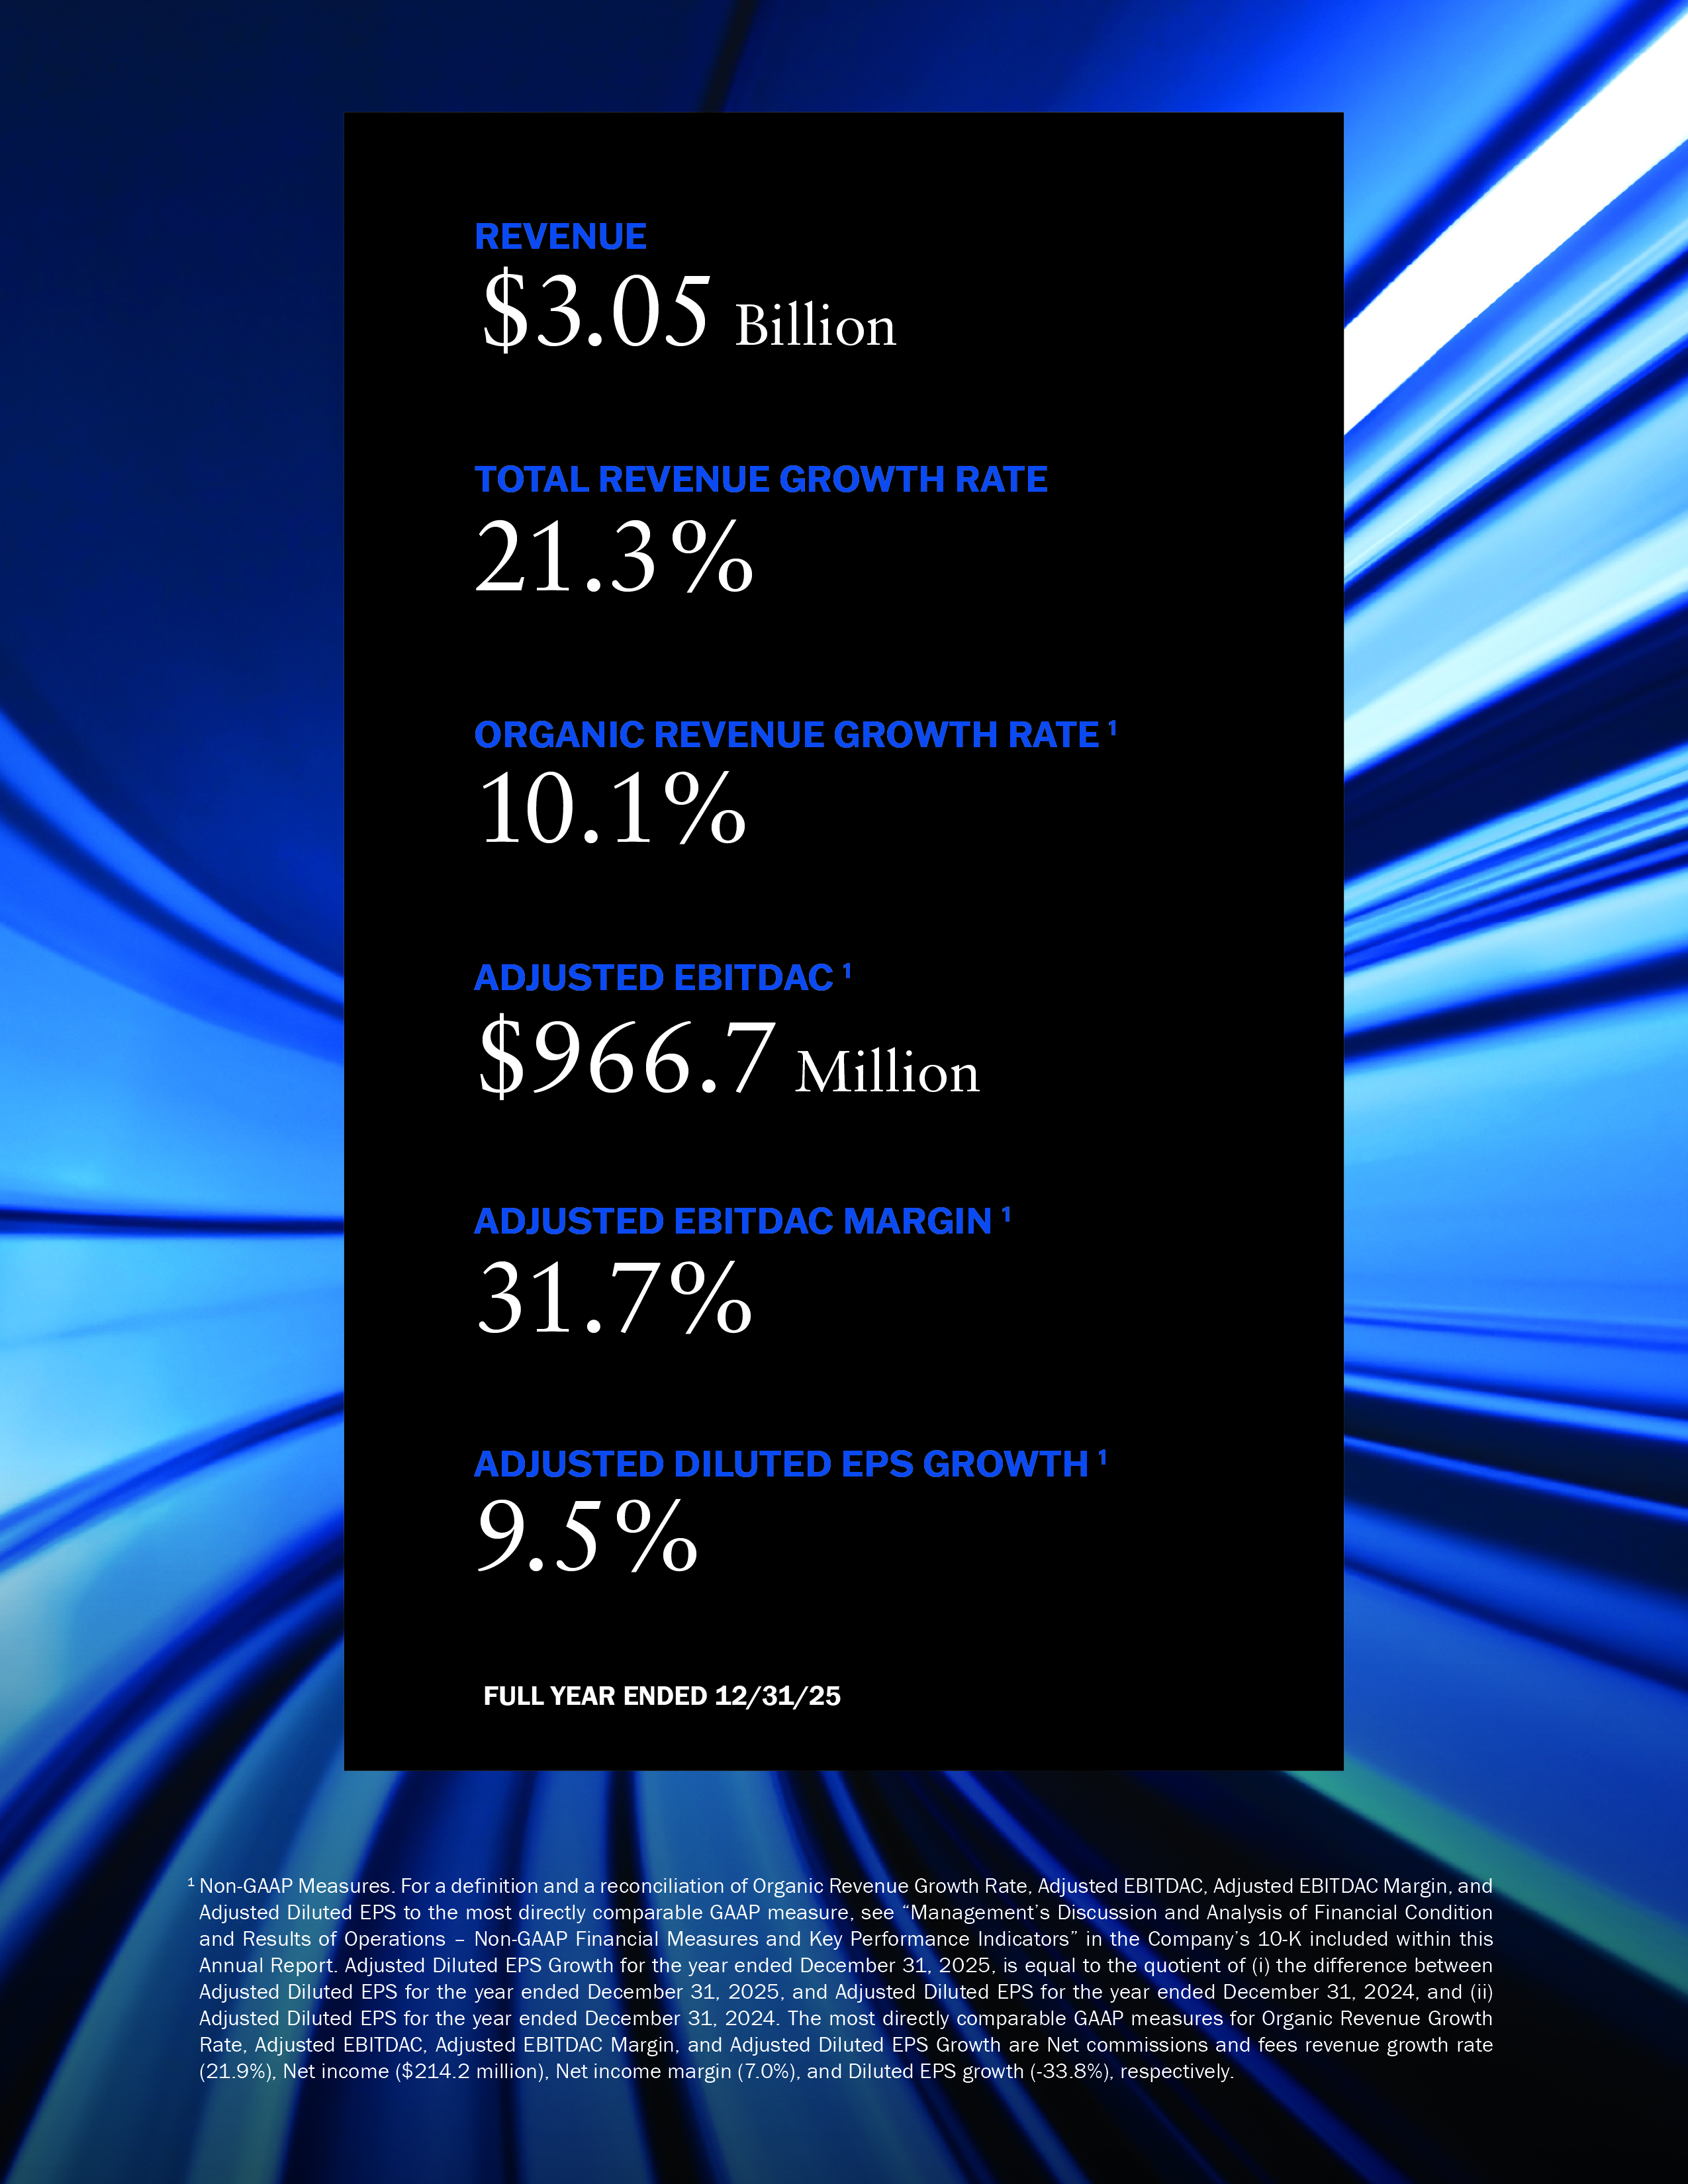
•Revenue surpassed $3.0 billion, up 21% year-over-year, driven by organic revenue growth¹ of
10.1% on top of 12.8% in 2024, and significant contributions from our M&A strategy.
•Adjusted EBITDAC¹ grew 19.2% to $967 million.
•Adjusted EBITDAC margin¹ of 31.7%.
•Adjusted Diluted EPS¹ grew 9.5% to $1.96.
•We completed 5 acquisitions, with trailing revenue of over $125 million.
Our Wholesale Brokerage specialty demonstrated remarkable resilience in 2025, led by our
exceptional talent and the continuation of secular trends like panel consolidation. In Property, our
team executed on behalf of our clients in the face of an exceptionally difficult pricing environment,
while our Casualty practice had a very strong year. Our team has shown a strong ability to navigate
many underlying trends that are moving in different directions across lines, but the net result remains
favorable for Ryan Specialty.
Our Delegated Authority specialties – Binding Authority and Underwriting Management – continued to
perform well. Today, our delegated authority business manages north of $10 billion in premium across
more than 300 products and has been recognized by Business Insurance as the largest delegated
authority platform in the US. We create bespoke solutions because our broker, agent, and insurance
carrier clients entrust us to solve problems alongside them.
Notably, Ryan Re, our reinsurance managing general underwriter started just over six years ago, has
become a remarkable business, strategically positioning us to capitalize on an expanded opportunity
set. We are very proud of our ability to execute on our strategic partnership with Nationwide on the
Markel reinsurance book, which is driving increased brand awareness, deeper client relationships,
and diversification into niche specialty markets.
Our strong M&A momentum continued into 2025, as we completed another exceptional year of
acquisitions. These acquisitions bolstered our property offering through Velocity Risk, added to our
growing Alternative Risk business through USQRisk, and enhanced our international footprint through
both 360° Underwriting and Stewart Specialty Risk Underwriting. M&A has been, and continues to be,
a top capital allocation priority for us, and we remain disciplined in our approach, only moving forward
when all of our criteria are met: a strong cultural fit, strategic, and accretive.
In 2025, we also successfully onboarded a number of top performers, attracted to Ryan Specialty by
our culture of innovation and empowerment, to further enhance our best-in-class team. We
capitalized on a unique moment of talent dislocation in the specialty and E&S market, recruiting at
scale in wholesale brokerage. Further, we added key data and AI-focused resources within our central
underwriting teams, integrated strong talent to support Ryan Re, and hired top-tier talent within
Alternative Risk. We’ve said it before: our recruitment, training, and development of talent is the
highest return and the best investment we can make, and it will continue to power our organic growth
engine for years to come.
We’ve significantly diversified our platform with new products, geographies, capabilities, and
businesses. This transformation has been exciting but with scale, comes complexity. Earlier this year,
we launched EMPOWER, our three-year restructuring program designed to streamline our broking,
binding, and underwriting operations, optimize our scale, accelerate our data, technology, and AI
strategies, and enhance efficiencies across all of our specialties. EMPOWER is about more than
efficiency – it is about enabling our people to do what they do best: more tools, faster innovation, and
an even greater ability to deliver for our broker, agent, and insurance carrier trading partners. These
anticipated efficiencies will create headroom for continued strategic investment in growth, top-tier
talent, de novo formations, and innovation, all contributing to our goal of margin expansion over time
while maintaining the flexibility to continue investing in our business.
We were pleased that our Board of Directors authorized Ryan Specialty’s inaugural share repurchase
program of $300 million. Our Board also approved an 8% increase to our regular quarterly dividend,
which we view as modest and sustainable. The addition of share repurchases, alongside continued
disciplined M&A, organic investment, and a growing dividend, gives us greater flexibility in how we
return value to our stockholders, which is supported by our consistent ability to meaningfully generate
strong free cash flow.
We believe 2026 will be another strong year for Ryan Specialty, even in the face of continued property
pricing softness. We expect to deliver another year of industry-leading organic growth, led by our
world-class team and differentiated platform. We will continue to invest in our business while
expanding margins in most years, maintaining the flexibility to capitalize on strategic opportunities.
Our scale, scope, and intellectual capital, thoughtfully crafted over our 15-year history, is unmatched.
It is the foundation of our ability to continue winning and expanding our market share over time. This
platform is exceedingly difficult to replicate, and we will continue investing to widen the gap between
Ryan Specialty and the rest of the specialty insurance industry.
Finally, we want to express our appreciation to our Ryan Specialty teammates for their amazing
dedication and unrelenting effort, which powers our success year after year. We are proud to lead
such a talented and motivated team and are incredibly excited about our future.
Thank you for your continued support.
Respectfully yours,


Patrick G. RyanTimothy W. Turner
Founder, Executive ChairmanChief Executive Officer
¹ Non-GAAP Measures. For a definition and a reconciliation of Organic Revenue Growth Rate, Adjusted EBITDAC, Adjusted
EBITDAC Margin, and Adjusted Diluted EPS to the most directly comparable GAAP measure, see “Management’s
Discussion and Analysis of Financial Condition and Results of Operations – Non-GAAP Financial Measures and Key
Performance Indicators” in the Company’s 10-K included within this Annual Report. Adjusted Diluted EPS Growth for the
year ended December 31, 2025, is equal to the quotient of (i) the difference between Adjusted Diluted EPS for the year
ended December 31, 2025, and Adjusted Diluted EPS for the year ended December 31, 2024, and (ii) Adjusted Diluted
EPS for the year ended December 31, 2024. The most directly comparable GAAP measures for Organic Revenue Growth
Rate, Adjusted EBITDAC, Adjusted EBITDAC Margin, and Adjusted Diluted EPS Growth are Net commissions and fees
revenue growth rate (21.9%), Net income ($214.2 million), Net income margin (7.0%), and Diluted EPS growth (-33.8%),
respectively.
UNITED STATES
SECURITIES AND EXCHANGE COMMISSION
Washington, D.C. 20549
_______________________________________________________________________________________________________________________________________________________________________________________________________________________________________________________________________________________________________________________________________________________________________________________________________________________________________________________________________________________________________________________________________________________________________________________________________________________________________________________
FORM 10-K
_______________________________________________________________________________________________________________________________________________________________________________________________________________________________________________________________________________________________________________________________________________________________________________________________________________________________________________________________________________________________________________________________________________________________________________________________________________________________________________________
(Mark One)
☒ | ANNUAL REPORT PURSUANT TO SECTION 13 OR 15(d) OF THE SECURITIES EXCHANGE ACT OF 1934 |
For the fiscal year ended DECEMBER 31, 2025
or
☐ | TRANSITION REPORT PURSUANT TO SECTION 13 OR 15(d) OF THE SECURITIES EXCHANGE ACT OF 1934 |
For the transition period from to
Commission file number: 001-40645
_______________________________________________________________________________________________________________________________________________________________________________________________________________________________________________________________________________________________________________________________________________________________________________________________________________________________________________________________________________________________________________________________________________________________________________________________________________________________________________________

RYAN SPECIALTY HOLDINGS, INC.
(Exact name of registrant as specified in its charter)
Delaware | 86-2526344 | |||
(State or Other Jurisdiction of Incorporation) | (IRS Employer Identification No.) | |||
155 North Wacker Drive, Suite 4000 Chicago, Illinois | 60606 | |||
(Address of Principal Executive Offices) | (Zip Code) |
Registrant’s Telephone Number, Including Area Code:312 784-6001
_______________________________________________________________________________________________________________________________________________________________________________________________________________________________________________________________________________________________________________________________________________________________________________________________________________________________________________________________________________________________________________________________________________________________________________________________________________________________________________________
Securities registered pursuant to Section 12(b) of the Act:
Title of each class | Trading Symbol | Name of each exchange on which registered | ||
Class A Common Stock, $0.001 par value per share | RYAN | The New York Stock Exchange |
Securities registered pursuant to Section 12(g) of the Act: NONE
_______________________________________________________________________________________________________________________________________________________________________________________________________________________________________________________________________________________________________________________________________________________________________________________________________________________________________________________________________________________________________________________________________________________________________________________________________________________________________________________
Indicate by check mark if the registrant is a well-known seasoned issuer, as defined in Rule 405 of the Securities Act. Yes ☒ No ☐
Indicate by check mark if the registrant is not required to file reports pursuant to Section 13 or Section 15(d) of the Exchange Act. Yes ☐ No ☒
Indicate by check mark whether the registrant (1) has filed all reports required to be filed by Section 13 or 15(d) of the Securities Exchange Act of 1934
during the preceding 12 months (or for such shorter period that the registrant was required to file such reports), and (2) has been subject to such filing
requirements for the past 90 days. Yes ☒ No ☐
Indicate by check mark whether the registrant has submitted electronically every Interactive Data File required to be submitted pursuant to Rule 405 of
Regulation S-T (§232.405 of this chapter) during the preceding 12 months (or for such shorter period that the registrant was required to submit such files).
Yes ☒ No ☐
Indicate by check mark whether the registrant is a large accelerated filer, an accelerated filer, a non-accelerated filer, a smaller reporting company, or an
emerging growth company. See the definitions of “large accelerated filer,” “accelerated filer,” “smaller reporting company,” and “emerging growth
company” in Rule 12b-2 of the Exchange Act.
Large accelerated filer | ☒ | Accelerated filer | ☐ | Non-accelerated filer | ☐ | Smaller reporting company | ☐ | Emerging growth company | ☐ |
If an emerging growth company, indicate by check mark if the registrant has elected not to use the extended transition period for complying with any new
or revised financial accounting standards provided pursuant to Section 13(a) of the Exchange Act. ☐
Indicate by check mark whether the registrant has filed a report on and attestation to its management’s assessment of the effectiveness of its internal
control over financial reporting under Section 404(b) of the Sarbanes-Oxley Act (15 U.S.C. 7262(b)) by the registered public accounting firm that
prepared or issued its audit report. ☒
If securities are registered pursuant to Section 12(b) of the Act, indicate by check mark whether the financial statements of the registrant included in the
filing reflect the correction of an error to previously issued financial statements. ☐
Indicate by check mark whether any of those error corrections are restatements that required a recovery analysis of incentive-based compensation received
by any of the registrant’s executive officers during the relevant recovery period pursuant to §240.10D-1(b). ☐
Indicate by check mark whether the registrant is a shell company (as defined in Rule 12b-2 of the Exchange Act). Yes ☐ No ☒
The aggregate market value of the voting common equity held by non-affiliates of the Registrant, computed by reference to the last reported price at
which the Registrant’s common equity was sold on June 30, 2025 (the last day of the Registrant’s most recently completed second quarter) was
$8,557,552,987.
On February 9, 2026, the Registrant had 264,189,701 shares of common stock outstanding, consisting of 129,680,816 shares of Class A common stock,
$0.001 par value, and 134,508,885 shares of Class B common stock, $0.001 par value.
_______________________________________________________________________________________________________________________________________________________________________________________________________________________________________________________________________________________________________________________________________________________________________________________________________________________________________________________________________________________________________________________________________________________________________________________________________________________________________________________
DOCUMENTS INCORPORATED BY REFERENCE
Portions of the registrant’s proxy statement for its 2026 Annual Meeting of Stockholders are incorporated by reference in this report in
response to Part III, Items 10, 11, 12, 13, and 14 which will be filed no later than 120 days after the Registrant’s fiscal year ended December 31, 2025.
COMMONLY USED DEFINED TERMS
As used in this annual report, unless the context indicates or otherwise requires, the following terms have the
following meanings:
•“we”, “us”, “our”, the “Company”, “Ryan Specialty”, and similar references refer to Ryan Specialty
Holdings, Inc., and, unless otherwise stated, all of its subsidiaries, including the LLC.
•“2030 Senior Secured Notes”: The 4.375% senior secured notes due 2030 issued under an Indenture dated
February 3, 2022.
•“2032 Senior Secured Notes”: The 5.875% senior secured notes due 2032 issued under an Indenture dated
September 19, 2024, as supplemented on December 9, 2024.
•“Adjusted Term SOFR”: The interest rate per annum based on SOFR, without any credit spread adjustment,
subject to a 0 basis point floor.
•“Admitted”: The insurance market comprising insurance carriers licensed to write business on an
“admitted” basis by the insurance commissioner of the state in which the risk is located. Insurance rates and
forms in this market are highly regulated by each state and coverages are largely uniform.
•“All Risks LTIP”: The legacy Long Term Incentive Plan of All Risks Specialty, LLC (f/k/a All Risk, Ltd.),
an insurance specialist providing services in wholesale brokerage and delegated underwriting authority
acquired by Ryan Specialty in September 2020.
•“Binding Authority”: Our Binding Authority Specialty receives submissions for insurance directly from
retail brokers, evaluates price, and makes underwriting decisions regarding these submissions based on
narrowly prescribed guidelines provided by carriers, and binds and issues policies on behalf of insurance
carriers who retain the insurance underwriting risk.
•“Board” or “Board of Directors”: The board of directors of Ryan Specialty.
•“Class C Incentive Units”: Class C common incentive units, initially of the LLC on and prior to September
30, 2021, and then subsequently of New LLC, are exchangeable into LLC Common Units.
•“Credit Agreement”: The credit agreement dated September 1, 2020, as amended, among Ryan Specialty,
LLC and JPMorgan Chase Bank, N.A., as administrative agent and the other lenders party thereto.
•“Credit Facility”: The Term Loan and the Revolving Credit Facility.
•“E&O”: Errors and omissions.
•“E&S”: Excess and surplus lines. In this insurance market, insurance carriers are licensed on a “non-
admitted” basis. The excess and surplus lines market often offers carriers more flexibility in terms,
conditions, and rates relative to the Admitted market.
•“Exchange Act”: Securities Exchange Act of 1934, as amended.
•“IPO”: Initial public offering.
•“LLC”: Ryan Specialty, LLC, together with its parent New LLC, and their subsidiaries.
•“LLC Common Units”: Non-voting common interest units initially of the LLC on and prior to September
30, 2021, and then subsequently of New LLC or LLC, as the context requires.
•“LLC Operating Agreement”: The Eighth Amended and Restated Limited Liability Company Agreement of
the LLC, as amended.
•“LLC Units”: Class A common units and Class B common units of the LLC prior to the Organizational
Transactions.
•“LLC Unitholders”: Holders of the LLC Units or the LLC Common Units, as the context requires.
•“MGA”: Managing general agent.
•“MGU”: Managing general underwriter.
•“New LLC”: New Ryan Specialty, LLC is a Delaware limited liability company and a direct subsidiary of
Ryan Specialty Holdings, Inc.
•“New LLC Operating Agreement”: The Third Amended and Restated Limited Liability Company
Agreement of New LLC, as amended.
•“Organizational Transactions”: The series of organizational transactions completed by the Company in
connection with the IPO, as described in Note 1 to the consolidated audited financial statements contained
in the Form 10-K filed with the SEC on March 16, 2022.
•“P&C”: Property and casualty insurance.
•“Revolving Credit Facility”: The $1,400 million revolving credit facility under the Credit Agreement.
•“Ryan Parties”: Patrick G. Ryan and certain members of his family and various entities and trusts over
which Patrick G. Ryan and his family exercise control.
•“SEC”: The Securities and Exchange Commission.
•“Securities Act”: Securities Act of 1933, as amended.
•“Senior Secured Notes”: The 2030 Senior Secured Notes and the 2032 Senior Secured Notes.
•“Specialty”: One of the three Ryan Specialty primary distribution channels, which includes Wholesale
Brokerage, Binding Authority, and Underwriting Management.
•“Stock Option”: A non-qualified stock option award that gives the grantee the option to buy a specified
number of shares of Class A common stock at the grant date price.
•“Tax Receivable Agreement” or “TRA”: The tax receivable agreement entered into in connection with the
IPO.
•“Term Loan”: The $1,700 million in aggregate principal amount senior secured Term Loan B under the
Credit Agreement.
•“U.S. GAAP”: Accounting principles generally accepted in the United States of America.
•“Underwriting Management”: Our Underwriting Management Specialty administers a number of MGUs,
MGAs, and programs that offer commercial and personal insurance for specific product lines or industry
classes. Underwriters act with delegated underwriting authority based on varying degrees of prescribed
guidelines as provided by carriers, quoting, binding, and issuing policies on behalf of Ryan Specialty’s
carrier trading partners which retain the insurance underwriting risk.
•“Wholesale Brokerage”: Our Wholesale Brokerage Specialty distributes a wide range and diversified mix
of specialty property, casualty, professional lines, personal lines, and workers’ compensation insurance
products, as a broker between the carriers and retail brokerage firms.
INFORMATION CONCERNING FORWARD-LOOKING STATEMENTS
This Annual Report on Form 10-K contains “forward-looking statements” within the meaning of the Private
Securities Litigation Reform Act of 1995 that involve substantial risks and uncertainties. All statements other than
statements of historical fact included in this Annual Report on Form 10-K are forward-looking statements. Forward-
looking statements give our current expectations relating to our financial condition, results of operations, plans, objectives,
future performance, and business. You can identify forward-looking statements by the fact that they do not relate strictly to
historical or current facts. These statements may include words such as “anticipate,” “estimate,” “expect,” “project,”
“plan,” “intend,” “believe,” “may,” “will,” “should,” “can have,” “likely,” and other words and terms of similar meaning in
connection with any discussion of the timing or nature of future operating or financial performance or other events. For
example, all statements we make relating to our estimated costs, expected benefits relating to our corporate restructuring
program, expenditures, cash flows, growth rates and financial results, any future dividends, our plans, and objectives for
future operations, growth or initiatives, strategies or the expected outcome or impact of pending or threatened litigation are
forward-looking statements. All forward-looking statements are subject to risks and uncertainties that may cause actual
results to differ materially from those that we expected, including:
•our failure to successfully recruit and retain our senior management team, revenue producers, or other key
employees, and to successfully plan and prepare for the succession of our senior management team;
•the potential loss of our relationships with insurance carriers or our clients, failure to maintain good
relationships with insurance carriers or clients, becoming dependent upon a limited number of insurance
carriers or clients, or the failure to develop new insurance carrier and client relationships;
•errors in, or ineffectiveness of, our underwriting models and the risks presented to our reputation and
relationships with insurance carriers, retail brokers, and agents;
•failure to maintain, protect, and enhance our brand or prevent damage to our reputation;
•the unsatisfactory evaluation of potential acquisitions or the failure to successfully integrate acquired
businesses and/or introduce new products, lines of business, and/or markets;
•our inability to successfully recover upon experiencing a disaster or other interruption in business
continuity;
•the impact of third parties that perform key functions of our business operations acting in ways that harm
our business;
•failure to maintain the valuable aspects of our Company’s culture;
•the cyclicality of, and the economic conditions in, the markets in which we operate and conditions that
result in reduced insurer capacity or a migration of business away from the E&S market and into the
Admitted market;
•a reduction in insurer capacity to adequately and appropriately underwrite risk and provide coverage;
•our international operations expose us to various international risks, including required compliance with
evolving legal and regulatory obligations, that are different, and at times more burdensome, than those set
forth in the United States;
•changes in interest rates and deterioration of credit quality could reduce the value of our cash balances or
interest income;
•significant competitive pressures in each of our businesses;
•decreases in premiums or commission rates set by insurers, or actions by insurers seeking repayment of
commissions;
•the impact if the contracts that govern our MGAs or MGUs are terminated or changed;
•a decrease in the amount of supplemental or contingent commissions we receive;
•our inability to collect our receivables;
•disintermediation within the insurance industry and shifts away from traditional insurance markets;
•impairment of goodwill and intangibles;
•the challenges with properly assessing, adapting to, and managing the adoption and use of artificial
intelligence and other evolving technologies;
•the inability to maintain strong growth and generate sufficient revenue to maintain profitability;
•the loss of clients or business as a result of consolidation within the retail insurance brokerage industry;
•the inability to achieve the intended results of our restructuring program;
•significant investment in our growth strategy and whether expectation of internal efficiencies are realized;
•the unavailability or inaccuracy of our clients’ and third parties’ data for pricing and underwriting insurance
policies;
•the competitiveness and cyclicality of the reinsurance industry;
•the occurrence of natural or man-made disasters;
•the impact on our operations and financial condition from the effects of a pandemic or the outbreak of a
contagious disease and resulting governmental and societal responses;
•the economic and political conditions of the countries and regions in which we operate;
•the failure, or take-over by the FDIC, of one of the financial institutions that we use;
•our inability to respond quickly to operational or financial problems or promote the desired level of
cooperation and interaction among our offices;
•our international operations expose us to various international risks, including exchange rate fluctuations;
•changing expectations over corporate responsibility and stakeholder interests;
•the impact of breaches in security that cause significant system or network disruption or business
interruption;
•the impact of improper disclosure of confidential, personal, or proprietary data, misuse of information by
employees or counterparties, or as a result of cyber incidents and cyberattacks;
•our inability to gain internal efficiencies through the application of technology, effectively apply
technology in driving value for our clients, or the failure of technology and automated systems to function
or perform as expected;
•the impact of infringement, misappropriation, or dilution of our intellectual property;
•the impact of the failure to protect our intellectual property rights, or allegations that we have infringed on
the intellectual property rights of others;
•the impact of evolving governmental regulations, legal proceedings, and governmental inquiries related to
our business;
•being subject to E&O claims, as well as other contingencies and legal proceedings;
•our handling of client funds and surplus lines taxes that exposes us to complex fiduciary regulations;
•changes in tax laws or regulations;
•decreased commission revenues due to proposed tort reform legislation;
•the impact of regulations affecting insurance carriers;
•our outstanding debt potentially adversely affecting our financial flexibility and subjecting us to contractual
restrictions and limitations that could significantly affect our ability to operate and manage our business;
•not being able to generate sufficient cash flow to service all of our indebtedness and being forced to take
other actions to satisfy our obligations under such indebtedness;
•being affected by further changes in the U.S. based credit markets;
•changes in our credit ratings;
•risks related to the payments required by our Tax Receivable Agreement;
•risks relating to our organizational structure that could result in conflicts of interests between the LLC
Unitholders, the Ryan Parties, and the holders of our Class A common stock;
•risks relating to our share repurchase program; and
•other factors disclosed in the section entitled “Risk Factors” in this Annual Report.
We derive many of our forward-looking statements from our operating budgets and forecasts that are based on
many detailed assumptions. While we believe that our assumptions are reasonable, we caution that it is very difficult to
predict the impact of known factors, and it is impossible for us to anticipate all factors that could affect our actual results.
Important factors that could cause actual results to differ materially from our expectations, or cautionary statements, are
disclosed under the sections entitled “Risk Factors” and “Management’s Discussion and Analysis of Financial Condition
and Results of Operations” in this Annual Report. All written and oral forward-looking statements attributable to us, or
persons acting on our behalf, are expressly qualified in their entirety by these cautionary statements as well as other
cautionary statements that are made from time to time in our filings with the SEC and other public communications. You
should evaluate all forward-looking statements made in this Annual Report in the context of these risks and uncertainties.
In addition, statements that “we believe” and similar statements reflect our beliefs and opinions on the relevant
subject. These statements are based upon information available to us as of the date of this Annual Report, and while we
believe such information forms a reasonable basis for such statements, such information may be limited or incomplete, and
our statements should not be read to indicate that we have conducted an exhaustive inquiry into, or review of, all
potentially available relevant information. These statements are inherently uncertain and investors are cautioned not to
unduly rely upon these statements.
We caution you that the important factors referenced above may not contain all of the factors that are important
to you. In addition, we cannot assure you that we will realize the results or developments we expect or anticipate or, even if
substantially realized, that they will result in the consequences or affect us or our operations in the way we expect. The
forward-looking statements included in this Annual Report are made only as of the date hereof. We undertake no obligation
to update or revise any forward-looking statement as a result of new information, future events or otherwise, except as
otherwise required by law.
i
TABLE OF CONTENTS
Item 7. Management’s Discussion and Analysis of Financial Condition and Results of Operations | |
1
PART I
ITEM 1. BUSINESS
Overview
Founded by Patrick G. Ryan in 2010, Ryan Specialty is an international specialty insurance intermediary that
provides specialty products, solutions, and services for insurance brokers, agents, and carriers. We provide distribution,
underwriting, product development, administration, and risk management services through our wholesale brokerage
platform and, on behalf of insurance carriers, through delegated underwriting authority via our managing underwriter,
binding authority, and national program operations. Our expertise spans an extensive array of property, casualty,
professional lines, transportation, personal lines, workers’ compensation, and employee benefits insurance. Our mission is
to provide industry-leading innovative solutions for insurance brokers, agents, and carriers.
For retail insurance brokers, we assist in the placement of complex or otherwise hard-to-place risks. For
insurance carriers, we work with retail and wholesale insurance brokers to source, onboard, underwrite, and service these
same types of risks. A significant majority of the premiums we place are bound in the E&S market, which includes Lloyd’s
of London, which we refer to as Lloyd’s. There is often significantly more flexibility in terms, conditions, and rates in the
E&S market relative to the Admitted or “standard” insurance market. We believe that the additional freedom to craft
bespoke terms and conditions in the E&S market allows us to best meet the needs of our trading partners, provide unique
solutions, and drive innovation. We believe our success has been achieved by providing best-in-class intellectual capital,
leveraging our trusted and long-standing relationships, and developing differentiated solutions at a scale unmatched by
many of our competitors.
Our plan for continued growth includes positioning ourselves as a pioneer in ever-changing markets, attracting
and developing industry-leading talent, broadening our product offerings organically and inorganically, and further
entrenching our deep industry relationships. We have been successful in each of these areas through our relentless focus on
serving each of our key constituents:
•Retail Insurance Brokers: Global, national, regional, and local retail insurance brokers rely on us to
provide expertise in specialty insurance lines and access to the best available coverage options on behalf of
insureds. Importantly, unlike some of our competitors, we have no retail operations, freeing us from
potential channel conflicts with our retail brokerage trading partners, which has been a cornerstone of our
strategy since our founding.
•Carriers: Insurance carriers, ranging from Lloyd’s syndicates to multi-line underwriters and E&S
specialists, rely on us to provide them with highly efficient, scaled distribution, specialty brokering and
underwriting management expertise, and high-quality insurance products. Insurance carriers also leverage
our comprehensive distribution network and deep knowledge to gain timely and cost-efficient access to
new risk classes and industries.
•Our Employees: Our professionals have extensive knowledge of the industries in which they specialize
and the complex insurance products we distribute and underwrite. We provide our employees with trusted
retail broker and insurance carrier relationships, proprietary products and innovative solutions, which
enable exceptional career advancement opportunities. We believe our reputation for helping our employees
advance their careers has made us a destination of choice for many of the most talented insurance
professionals in the industry.
Who We Are
We are a specialty insurance intermediary offering wholesale insurance brokerage and delegated underwriting
authority products and services through both traditional insurance and alternative risk solutions. We are the second-largest
U.S. P&C insurance wholesale broker and the largest U.S. P&C managing underwriter based on 2024 premium volume as
published in the Excess & Surplus Lines Market special report from Business Insurance. Our distribution network
encompasses over 700 individuals directly responsible for revenue generation in our Wholesale Brokerage and Binding
Authority Specialties (each, a “Producer” and together, the “Producers”) and our Underwriting Management Specialty
which develops and underwrites over 300 individual products. This provides us access to over 35,000 retail brokerage
firms and over 350 insurance carriers. We are compensated primarily through commissions and fees for the services we
provide.
2
Our business was founded to address the growing need for specialists in the increasingly important specialty
and E&S markets. For the year ended December 31, 2025, 78% of the total premiums we placed were in the E&S market.
The E&S market has been driven by the continued emergence of large, complex, and high-hazard risks across many lines
of insurance. These risks include more severe hurricanes that occur with greater frequency, more devastating wildfires,
more frequent flooding and convective storms, escalating jury verdicts and social inflation, geographic shifts in population
density, a proliferation of cyber threats, novel health risks, risks associated with large sports and entertainment venues,
building and labor cost inflation relative to insured value, and the transformation of the economy to a “digital first” mode
of doing business.
Compared to Admitted carriers, E&S insurance carriers often have more flexibility to quickly adjust coverage
terms, pricing, and conditions in response to market needs and dynamics. This practice is commonly referred to as
“freedom of rate and form,” which can facilitate coverage that would not otherwise be attainable. With greater flexibility,
E&S underwriters can tailor insurance products to meet emerging risks, the needs of insureds, and the risk appetite of
insurance carriers. As a result, the emergence of complex, unique, or otherwise hard-to-place risks, and the need for
specialty solutions, have driven meaningful growth within the E&S market.
Based on data from AM Best, the U.S. E&S market (which comprised $130 billion of direct written premium in
2024) has grown at a CAGR of 10.6%, compared to 4.4% for the U.S. Admitted market, between 2010 and 2024. E&S
market share as a percentage of total U.S. commercial insurance premium increased from 13.5% in 2010 to 25.7% in 2024.
We believe the higher rate of growth of the E&S market is due to the shift towards complex risks, insulating the E&S
market from broader economic trends. We expect that this trend will continue.
2010-2024 Commercial Lines Market Size CAGR1
1 Admitted P&C direct premiums written (“DPW”) calculated as Commercial
Lines direct premium written per S&P Global Market Intelligence, less E&S DPW
per AM Best
E&S Market Share Commercial Lines P&C Industry2
2 E&S market share calculated as E&S DPW per AM Best divided by Commercial
Lines DPW from state pages per S&P Global Market Intelligence
We have been able to increase our market share by offering custom solutions and products to better address
changing market fundamentals. Historically, smaller wholesale insurance brokers have relied on a go-to-market strategy
that is primarily predicated on facilitating access to underwriting capacity. As risks in the E&S market continue to become
more complex, increasingly global and higher hazard, simply offering market access to retail insurance brokers is no longer
sufficient. We believe that as risks become more complex, the E&S market will continue to become more material and
wholesale brokers that do not have sufficient scale or the financial and intellectual capital to invest in the required specialty
capabilities will struggle to compete effectively. This dynamic will continue the trend of market share consolidation among
the wholesale insurance brokers that have these capabilities.
Our growth has been further supported by the rapid consolidation among retail insurance brokers and the
consolidation of their wholesaler trading partner relationships. During 2025, retail insurance brokers completed 695 merger
and acquisition (“M&A”) transactions according to OPTIS Partners, compared to 787 in 2024, 835 in 2023, and 1,032 in
2022. According to Business Insurance, this M&A velocity contributed to the Top 100 retail brokers growing revenue by
over 14% in 2024. As retail brokers continue to become larger, they focus on maintaining and establishing relationships
with fewer, more trusted wholesale brokers. This approach, commonly known as “wholesale panel consolidation,” ensures
that the retail brokers have quality, clarity, and consistency across their operations and insurance placement. The trend of
wholesale panel consolidation started in 2011 among global retail insurance brokers and was subsequently replicated by
middle-market retail brokers. We believe that retail insurance brokers will continue to favor having us on their wholesale
panels as a preferred trading partner because we have national scale, top-flight talent, a full suite of product solutions, and
3
are free from channel conflicts with their retail operations. We expect that these dynamics will foster growth in the amount
of premiums we place from these existing retail broker relationships.
Similarly, there has been meaningful consolidation among P&C insurance carriers over the past two decades,
including significant commitment to the E&S market by predominantly admitted carriers, along with new entrants focused
on the specialty and E&S markets. This carrier consolidation likewise provided more opportunities for a smaller group of
well-positioned insurance specialists best equipped to provide the necessary services with the requisite scale and talent.
Our core value proposition to retail insurance brokers and carriers is delivering best-in-class intellectual capital.
Our people are our source of intellectual capital. We have sought to attract, develop, and retain many of the most skilled
specialty insurance professionals in the industry. We seek to attract leading talent into our organization by offering a
purpose-driven culture, a wide range of opportunities for career advancement, and a platform for success through the
breadth of our retail insurance broker relationships. We have access to over 35,000 retail insurance brokerage firms,
including preferred relationships with all of the top 100 retail insurance brokers. We have been highly successful in our
recruiting and retention efforts and are a destination of choice for top-tier talent. Typically, each cohort of Producers hired
since 2016 has generated revenue which exceeded compensation costs by the end of such cohort’s second full year.
Ensuring individual Producer book of business growth is critical for our business as it supports our organic growth,
motivates our Producers, and fosters retention. In 2025, our Producer retention rate was 96%. We continue to make
significant investments in people. We have formalized our Producer sourcing and development program through the
establishment of Ryan Specialty University, allowing us to even more effectively cultivate talent across all specialties. We
expect this program will continue to drive growth in the future.
Our Producers are able to offer retail insurance brokers multi-channel access to E&S and Admitted markets
through our three Specialties: Wholesale Brokerage, Binding Authority, and Underwriting Management.
•Wholesale Brokerage: Our Wholesale Brokerage Specialty operates predominantly under the brand “RT
Specialty” along with others such as “RT ProExec” and “CERT.” Wholesale Brokerage assists retail
brokers in procuring a wide range and diversified mix of specialty property, casualty, professional lines,
personal lines, and workers’ compensation insurance products from insurance carriers. We provide
insurance carriers with efficient variable-cost distribution in all 50 states through our extensive
relationships with retail brokers. For the years ended December 31, 2025 and 2024, our Wholesale
Brokerage Specialty generated $1,600.4 million in net commission and fees, representing 53.4% of our
total net commission and fees, and $1,489.1 million in net commission and fees, representing 60.6% of our
total net commission and fees, respectively.
•Binding Authority: Our Binding Authority Specialty operates under the “RT Specialty,” “Connector,” and
“RT Binding Authority” brands. Binding Authority provides timely and secure access to our carrier trading
partners that have delegated underwriting authority and critical administrative and distribution
responsibilities to us through our in-house binding agreements. A significant component of our growth in a
majority of this business comprises larger volume, smaller premium policies with well-defined
underwriting criteria which allows us to combine swift turnaround with the authority to bind insurance
carriers to coverage regardless of the complexity of risk. For the years ended December 31, 2025 and 2024,
our Binding Authority Specialty generated $370.2 million in net commission and fees, representing 12.4%
of our total net commission and fees, and $320.4 million in net commission and fees, representing 13.0% of
our total net commission and fees, respectively.
•Underwriting Management: Our Underwriting Management Specialty operates under multiple brands,
which are collectively referred to as “Ryan Specialty Underwriting Managers.” Our Underwriting
Management Specialty offers insurance and reinsurance carriers cost-effective specialty market expertise in
distinct and complex market niches underserved in today’s marketplace through 39 MGAs and MGUs,
which act on behalf of insurance and reinsurance carriers. These carriers have provided us the authority to
design, underwrite, and bind coverage, and administer policies for specific risks. We also have a National
Programs Platform that, together with our MGAs and MGUs, offers commercial insurance for specific
product lines or industry classes. Ryan Specialty Underwriting Managers offers a broad distribution
platform through a network of retail, wholesale, and reinsurance brokers, including RT Specialty. For the
years ended December 31, 2025 and 2024, our Underwriting Management Specialty generated $1,024.0
million in net commission and fees, representing 34.2% of our total net commission and fees, and $646.2
million in net commission and fees, representing 26.3% of our total net commission and fees, respectively.
4
We have significantly enhanced our human capital, product capabilities, and geographic footprint through
strategic acquisitions. Since inception, we have partnered with over 60 firms through acquisition. These firms represent a
diverse mix of specialties and geographies, allowing us to better service both existing and prospective trading partners. The
targets that we acquired in 2025 had revenues for the unaudited twelve-month period prior to acquisition of over $125
million. We are highly selective in our M&A strategy and focus on partners that share our long-term approach, inclusive
culture and commitment to integrity and client centricity. We primarily source our acquisitions through proprietary
dialogue with potential partners and selectively take part in auction processes in which we believe we have a differentiated
approach or value proposition. We take a consistent and disciplined approach to deal structuring and integration in order to
best ensure that our partners are positioned to succeed after the acquisition.
We believe that we have a number of competitive advantages in M&A compared to our competition, including
robust access to capital, freedom of channel conflict in the retail market with our retail insurance broker clients, the ability
to leverage our distribution platform and back-office operations to drive revenue and cost synergies through a systematic
approach to integration, and a strong underlying value proposition. We have typically sought to partner with entrepreneurs
who are seeking to join a firm that can give them broader product capabilities and enhanced access to retail insurance
brokers and carriers. We believe we are the partner of choice for firms and teams seeking to benefit from the resources of a
larger organization without sacrificing culture, entrepreneurial spirit, and the desire to grow. We continuously evaluate
acquisitions, maintain a robust pipeline, and are currently in active dialogue with several potential new partners. We have
previously made, and intend to continue to pursue, acquisitions with the objective of enhancing our human capital, product
capabilities, natural adjacencies, and geographic footprint.
The key attributes we seek in our acquisition partners are that they have a strong track record of organic revenue
growth, have the ability to enhance our market presence, can be accretive to our business, can enhance our talent base, are
geographically diverse, provide complementary product lines, and possess a high-quality management team that is aligned
with our culture.
We leverage technology to drive both productivity and efficiency. This includes the use of generative artificial
intelligence (“AI”), analytics, and customized technology platforms to establish a competitive edge for our brokers and
underwriters, while also enhancing operational efficiencies that support our scalability across business units and
geographies. In 2025, we rolled out a proprietary version of ChatGPT for all of our employees, commenced
implementation of an enhanced workbench for our underwriters, and initiated our use of generative AI to automate certain
aspects of insurance submission intake and analysis for our underwriters.
We have also created a digital marketplace, RT Connector, through which our retail clients and internal
producers can receive quotes and bind policies online. It can produce multiple bindable quotes sourced from high-quality
carriers across several risk classes in minutes. In cases when certain risks do not fit into RT Connector’s highly automated
underwriting criteria, the retail insurance broker is automatically directed to our Producers and underwriters for more
traditional placement methods. This holistic approach and integrated service model allow us to better serve retail insurance
brokers because we can place their smaller-premium accounts efficiently, aggregate more of their submissions rapidly, and
bind more policies for them cost-effectively. We have also connected with several “digital first” retail trading partners as a
wholesale digital distributor. Under these arrangements, policies that do not fit our trading partner’s Admitted markets
platform are referred directly into the RT Connector platform for access to specialty and E&S solutions.
Our financial performance reflects the strength of our strategy and business model, including a 21.3% and
21.1% increase in revenue for the years ended December 31, 2025 and December 31, 2024, respectively. This rapid pace of
growth was accompanied by Diluted earnings per share of $0.47 and $0.71 in 2025 and 2024, respectively. Our Adjusted
diluted earnings per share increased from $1.79 in 2024 to $1.96 in 2025. Please see “Note 11, Earnings Per Share” in the
footnotes to the Consolidated Financial Statements in this Annual Report for additional information. Adjusted diluted
earnings per share is a non-GAAP metric. For a reconciliation of Adjusted diluted earnings per share to its most directly
comparable GAAP metric, Diluted earnings per share, please see “Management’s Discussion and Analysis of Financial
Condition and Results of Operations – Non-GAAP Financial Measures and Key Performance Indicators” included
elsewhere in this Annual Report.
Industry Overview
As a wholesale distributor, we operate within the broader P&C insurance distribution market, which comprises
both wholesale insurance brokers and retail insurance brokers. Wholesale and retail insurance brokers facilitate the
placement of P&C insurance products in both the E&S and Admitted markets.
5
P&C Insurance Market
Insurance carriers sell commercial P&C products in the United States through one of two markets: the Admitted
or “standard” market and the E&S market. Approximately 74% of U.S. premiums are generated through the Admitted
market, which has highly regulated rates and policy forms. As a result, products in the Admitted market are relatively
uniform in price and coverage. According to data from AM Best, the E&S market comprised $130 billion of direct written
premium in 2024. In the E&S market, insurance carriers have more flexibility to customize rates and coverage. This
flexibility facilitates the underwriting of risks which are characterized by a complex profile, unique nature, size or are
otherwise difficult to place. The overall top five U.S. writers of E&S products in 2024 included: Berkshire Hathaway Ins
Grp., American International Grp., Fairfax Financial (USA) Grp., W. R. Berkley Insurance Grp., and Markel Insurance
Group, with whom we maintain meaningful relationships. Lloyd’s, which represents a market of 92 syndicates, is also a
prominent player in the E&S space and approximately 16% of 2024 E&S premiums in the United States were for insurance
coverage placed in the Lloyd’s market according to AM Best.
P&C Insurance Distribution Market
P&C insurance distribution is dependent on premium volumes in the P&C market as distributors typically
receive a commission based on a percentage of the dollar amount of the premiums placed. The dollar amount of premiums
placed is a function of both insurance rates and the underlying amount of coverage purchased, which is affected by broader
macroeconomic conditions, capital availability, and carrier loss trends in the class of risk and/or the specific insured. There
are broadly two types of insurance distributors: retail distributors (also called retail insurance brokers) and wholesale
distributors. Retail insurance brokers source insurance buyers and act as an intermediary between the insurance buyer and
insurance carriers. Wholesale distributors act as intermediaries between retail insurance brokers and insurance carriers by
assisting in the placement of “specialty” risks that are outside of the retail insurance brokers’ core expertise, complex, high-
hazard, or otherwise hard to place.
Wholesale Insurance Distribution Market
The wholesale insurance distribution market enhances efficiencies for both retail insurance brokers and
insurance carriers. Retail insurance brokers rely on wholesale distributors, such as ourselves, to assist in securing insurance
coverage for complex or specialty risks. The primary market for these insurance placements is the E&S market, where
retail insurance brokers often must utilize wholesale distributors who have distinct expertise and execution capabilities with
specialized carriers. According to AM Best, from 2019 to 2024, wholesalers were involved in placing on average 81% of
annual E&S premiums. E&S insurance carriers rely on wholesale insurance distributors for product expertise and
distribution capabilities. By leveraging Ryan Specialty as a wholesale distributor, E&S insurance carriers are able to access
a national network that includes over 35,000 retail insurance brokerage firms in a highly efficient manner, while
simultaneously enhancing the quality of policy submissions by using a knowledgeable counterparty. Insurance carriers also
leverage our comprehensive distribution network and deep knowledge to gain timely and cost-efficient access to new risk
classes and industries.
Wholesale distributors, who are typically compensated through commissions paid on insurance policies placed
on behalf of retail insurance brokers, share a portion of these commissions with the retail insurance broker and recognize
revenue on a net basis. Wholesale distributors can also receive fees in addition to commissions for placing certain
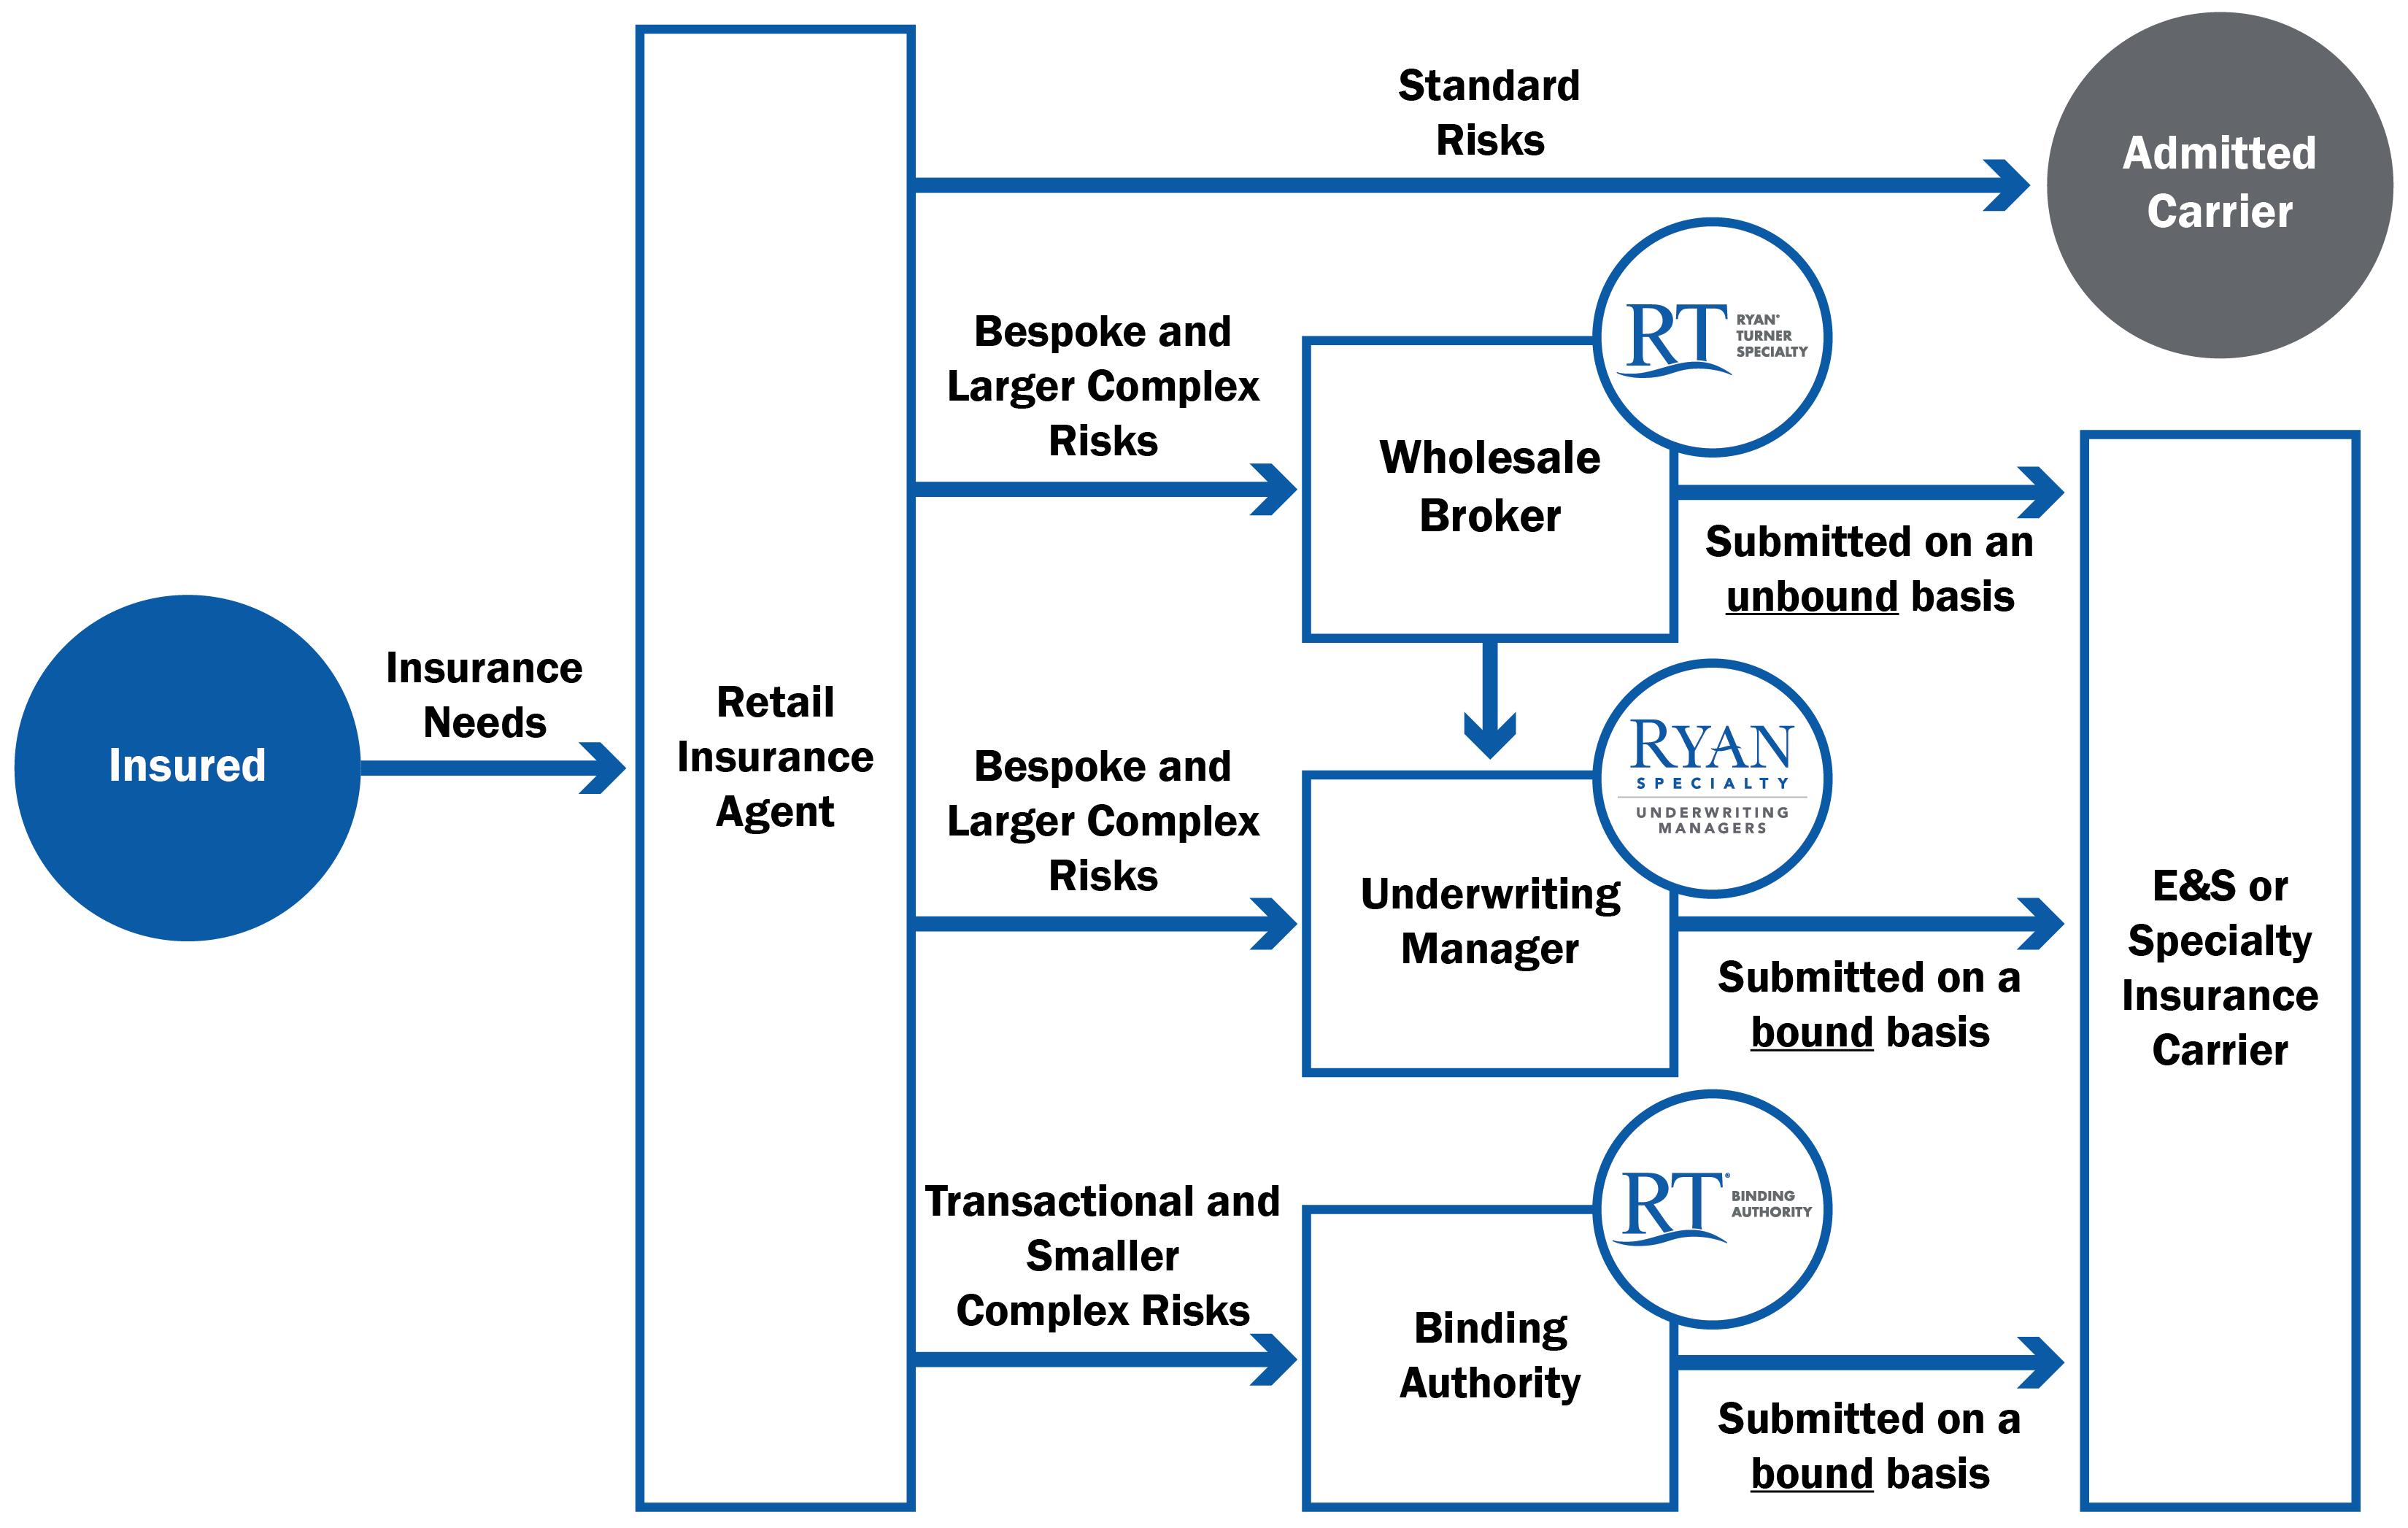
insurance policies. Wholesale distributors generally utilize one of three methods to place insurance risks into the E&S
market:
•Wholesale brokerage: 49% of 2024 E&S premiums were placed by wholesale insurance brokers without
binding authority, according to AM Best. This method, also referred to as “open brokerage,” is most similar
to our Wholesale Brokerage Specialty and includes a wide range and diversified mix of products.
•Program manager, MGA/MGU: 23% of 2024 E&S premiums were placed by program managers, including
MGUs and MGAs, according to AM Best. This method is most similar to our Underwriting Management
Specialty and allows wholesale distributors to underwrite coverage on behalf of an insurance carrier for a
specific type of risk, with relatively expansive delegated authority subject to agreed-upon guidelines and
limits.
•Wholesale brokerage with binding authority: 8% of 2024 E&S premiums were placed by wholesale
insurance brokers with binding authority, according to AM Best. This method is most similar to our
Binding Authority Specialty and utilizes in-house binding agreements, with a relatively limited scope of
delegated authority, to facilitate rapid execution.
6
The following summarizes the U.S. insurance distribution value chain:
How We Win
We believe our success is attributable to providing best-in-class intellectual capital, leveraging our trusted and
long-standing relationships, and developing differentiated solutions at a scale and level of quality unmatched by most of
our competitors. These characteristics have allowed us to consistently win business and grow faster than our competition.
Compete with best-in-class intellectual capital and drive consistent innovation: Historically, wholesale
distributors simply provided retail insurance brokers with E&S market access. We believe this practice is an antiquated go-
to-market approach. The inherent weakness of this model has been illuminated as retail insurance brokers have
consolidated and the risks placed into the E&S market have grown larger, have become more complex and are higher
hazard. We are able to thrive by not just providing market access, but by also constantly offering differentiated and
innovative solutions. Our professionals have extensive industry experience and deep product knowledge, allowing us to
match risk with the appropriate insurance carriers, or other capital, and develop bespoke solutions in addition to providing
distribution. By harnessing our collective knowledge, creativity, and relationships, we offer our clients and trading partners
the expertise necessary to pursue new industries and new opportunities in an increasingly complex world. In order to foster
our culture of innovation, we focus on recruiting, retaining, and developing the best-in-class wholesale professionals in the
industry.
Deep connectivity with retail brokerage firms: While we empower our Producers to develop strong
relationships with individual retail insurance brokers, we also engage with retail brokerage firms holistically. Our executive
management team has long-standing relationships with the leadership teams at numerous retail brokerage firms; many of
these relationships pre-date some of our management’s tenure at Ryan Specialty. Reporting to our executive management
team are practice leaders who are aligned to the distribution channels within many retail brokerage firms. We employ
experienced practice leaders across all broad classes of business, including property, casualty, and professional & executive
liability coverages, in addition to specialists who run highly focused distribution channels such as construction, cyber,
transportation, renewable energy, professional liability, medical stop loss and other employee benefits coverage, alternative
risk, excess casualty, and transactional liability. Through our comprehensive connectivity with retail brokerage firms, we
are able to deliver holistic, higher-quality, and more consistent solutions. We believe it takes strategic organizational
design, deep existing relationships between retail brokerage firms and executive management, practice leaders, and
individual retail producers, as well as meaningful scale and top-tier talent, to achieve this level of connectivity.
Collaborative relationships with insurance carriers: We align with our carrier trading partners, providing
them with access to specialized and often proprietary binding authority and underwriting management capabilities, broad
distribution, and deep industry expertise. We have also assisted insurance carriers that traditionally have operated in the
admitted market enter into the E&S industry. We provide our carrier trading partners with a durable value proposition with
7
a commitment to, and ongoing investment in, talent, technology, and governance. We offer 39 MGAs/MGUs and our
National Programs Platform, which together offer commercial insurance for specific product lines or industry classes. The
diversity of our offerings enables our carrier trading partners to cost-efficiently access new risk classes in a timely manner,
including on a delegated authority basis. We believe our carrier relationships are built on trust, industry credibility, and our
ability to deliver attractive underwriting results, growth, and scale over the long term. Our success is evident through our
ability to attract and retain industry leading specialized underwriting talent, develop new products and capabilities, onboard
additional capacity, and deepen relationships across our carrier trading partners. We work with the largest insurance
carriers in the E&S industry, which have consistently provided us long-term capital support. We are trading partners with
each of the top 25 U.S. E&S insurance carriers, as ranked by AM Best, numerous Lloyd’s syndicates, and U.K. and other
international insurance companies. As a reflection of the strength of these relationships, our carrier trading partners will
refer acquisition candidates to us, or proactively engage with us to develop new programs.
Comprehensive, full service product offering: Our success has been driven by our ability to provide broad
and innovative product offerings that continue to meet the needs of our trading partners, regardless of complexity or risk
profile. To provide this comprehensive level of service, we have developed a full suite of products, relationships, and
capabilities. Our Wholesale Brokerage Producers are highly regarded for their ability to procure coverage for the largest,
most complex, and high-hazard risks. Our wholesale brokers are able to place policies for challenging risks, such as:
coastal properties, kidnap and ransom exposures, hospitals and long-term care facilities, trucking fleets and commercial
transportation liability, large construction projects, large apartment schedules, and waste haulers. Our Binding Authority
Producers are renowned for their ability to quickly bind smaller accounts with unique attributes. Our Underwriting
Management Specialty offers retail and wholesale brokers a wide assortment of risk solutions for highly specialized
insurance coverage needs, such as: renewable energy, environmental, construction, cyber, builder’s risk, transportation,
transactional risk, long-term care facilities, catastrophe-exposed properties, and sports, leisure, and entertainment venues.
Our comprehensive suite of products and services and our broad geographic footprint allow us to place coverage for nearly
any risk brought to us by the over 35,000 retail insurance brokerage firms with which we do business. We believe that it
would be difficult for a new entrant to replicate the intellectual capital behind the breadth and depth of our product
offerings.
Free of channel conflict with retailer brokers: Our fundamental philosophy is that our clients’ interests must
always come first. In developing our distribution strategy, we have proactively avoided channel conflicts with our clients,
including in retail insurance distribution. Many of our competitors, including some of our largest, have taken a different
approach. We believe that the divergence in strategy has facilitated and solidified our presence on the wholesale panels of
nearly all of the most significant retail brokerage firms. Our position on numerous wholesale panels and aligned interests
with retail insurance brokers enhances our reputation as a destination of choice for the most talented producers, enhances
the market opportunity for our existing Producers, and cements our position as a source of intellectual capital for insuring
specialty risks.
Visionary, iconic, and aligned leadership team: We were founded by Patrick G. Ryan, a widely respected
entrepreneur and global insurance leader who previously founded Aon, one of the largest global retail insurance brokers,
and who served as Aon’s Chairman and/or CEO for 41 years. Mr. Ryan served as our Chairman and CEO from our
founding through the implementation of our executive succession plan, which took effect in 2024. Mr. Ryan now serves as
our Executive Chairman, remaining part of our executive management team and continuing as Chairman of the Board.
Timothy W. Turner succeeded Mr. Ryan as our CEO in 2024, after serving as our President since our IPO and leading RT
Specialty since our founding. Mr. Turner began his career in the insurance industry in 1987 and, prior to joining Ryan
Specialty, he was with CRC Insurance Services, Inc. for 10 years and was its President at the time of his departure. Messrs.
Ryan and Turner are joined by an experienced leadership team, each member of which has significant experience in the
wholesale distribution market. Our management team and employees also have significant alignment with stockholders. As
of December 31, 2025, we had over 1,000 employee stockholders, including each of our top 50 Producers. Our
management team and employees remain committed to our vision of market leadership by providing differentiated
intellectual capital, building trusted relationships, and pioneering risk solutions.
Our Strategy
We intend to grow our business by pursuing the following strategies:
Attract, retain, and develop human capital: Our people are the key to our success, so we have long focused
on attracting and developing the most talented professionals in the industry. Since the beginning of 2018, we have recruited
128 Producers who are now responsible for over $1.2 billion of annual premiums (figures exclude Producers who are not
associated with a discrete book of business). We have formalized our talent sourcing and development program through
8
our commitment to Ryan Specialty University. This development platform allows us to cultivate talent across all levels and
specialties. We are able to retain new and tenured employees alike by offering unprecedented market access, supporting
Producers in growing their books, and providing broad opportunities for rapid career advancement within our organization.
For example, in 2025 and 2024, 71% and 78%, respectively, of our Producers grew their book of business. Our ability to
retain top talent is a core objective of our strategy, exemplified by the fact that from 2020 through 2025 our annual
retention rate has been 96% or greater.
Lead with innovation in an ever-changing market: We believe that change is inevitable and necessary. We
further believe in the relentless pursuit of innovation in order to respond to evolving market conditions and to reach
underserved specialty markets. Accordingly, our business is built to respond to rapidly shifting market conditions by
constantly looking for ways to broaden and enhance our product offerings. For example, many of our 13 de novo MGUs
were formed to respond to emerging risks such as life sciences (LifeScienceRisk), renewable energy (PERse®), excess
commercial general liability (Emerald Underwriting Managers), builder’s risk (TRU), and personal lines (Verdant). We
developed Ryan Re Underwriting Managers, LLC (“Ryan Re”) to serve as an MGU in collaboration with Nationwide to
create new opportunities for both organizations to grow their presence in the specialty lines market, which in turn expanded
the reach of our underwriting management services into the reinsurance market. We use generative AI, data analytic tools,
and other technologies to enhance our operational efficiencies and establish a competitive edge for our brokers and
underwriters. In addition, we created RT Connector to be a unique technology entrant into the E&S space. RT Connector
allows us to better serve retail insurance brokers by placing their smaller-premium accounts efficiently, evaluating more of
their submissions rapidly, and binding more policies for them cost-effectively. We believe in the relentless pursuit of
innovation in order to respond to evolving market conditions and to reach underserved specialty markets.
In 2023, we completed the acquisition of three companies that specialize in broking, distributing, and
underwriting employee benefits insurance products and services: ACE Benefit Partners, Inc., Point6 Healthcare, LLC, and
AccuRisk Holdings, LLC. These acquisitions are core to our employee benefits platform, enabling us to provide our retail
broker clients and other trading partners with employee benefits specialty products and services, including medical stop
loss, group benefit captives, pharmacy, voluntary benefits, care management, and an integrated health solution. Our
employee benefits practice extends our addressable market and provides additional value to our retail broker clients and
their insureds.
In 2024, we completed seven acquisitions that we believe significantly increased our underwriting management
total addressable market in both the U.S. and internationally. These acquisitions brought us seasoned management teams
that enhance our ability to bring new product innovation to market, proprietary technology that will provide a competitive
edge into the future, and additional product offerings that serve to diversify the existing portfolio contained in our
Underwriting Management Specialty.
In 2025, we completed the acquisition of five companies, including Velocity Risk Underwriters, LLC, an MGU
specializing in first-party insurance coverage for catastrophe exposed properties, USQRisk Holdings, LLC, a company that
significantly expanded our alternative risk profile, and Stewart Specialty Risk Underwriting Ltd., an MGU based in
Toronto and our first significant acquisition in Canada.
We have identified the following markets, products, and/or services as near-term potential growth opportunities:
alternative risk and capital management offerings, employee benefits, nursing homes and other long-term care facilities,
transportation, life-sciences, public entities and municipalities, higher education, sports and entertainment venues, high net
worth property, residential housing starts, and New York construction and habitational spaces.
Pursue strategic acquisitions and align interests to enhance the network effect: Since our inception, we
have a history of successfully executing and integrating acquisitions across a diverse mix of specialties and geographies.
Our acquisition strategy is centered on increasing our intellectual capital, distribution reach, and product capabilities, which
mutually reinforce one another. We take a consistent and disciplined approach to deal structuring and integration in order
to ensure both that our partners are positioned to succeed after the acquisition and interests are aligned between ourselves
and our new teammates. When we acquire Wholesale Brokerage businesses, they gain access to over 35,000 retail
insurance brokerage firms, including preferred relationships with all of the top 100 retail insurance brokers and exclusive
product capabilities. When we acquire underwriting managers, they gain access to our wholesale Producers, deep carrier
and other capital provider relationships, and visionary leadership. As we continue to grow, these positive network effects
become stronger. The connectivity among our Specialties, as well as with key trading partners, enhances the value of our
platform to recruited Producers and presents a highly attractive value proposition to acquisition partners.
9
Deepen and broaden our relationships with retail broker trading partners: Retail insurance brokers have
multiple wholesale distribution relationships, even those that have consolidated their wholesale panels. We believe we have
the ability to transact in even greater volume with nearly all of our existing retail brokerage trading partners. For example,
in 2025, our revenue derived from the Top 100 firms (as ranked by Business Insurance) expanded faster than our 2025
organic revenue growth rate of 10.1%. Key to deepening our relationships with retail insurance brokers will be expanding
our product offerings and enhancing our geographic footprint through organic initiatives, continued producer hires, and
strategic acquisitions. Additionally, we will continue to broaden our footprint by establishing new retail broker trading
partner relationships. Beyond the traditional wholesale P&C opportunities, we also expect to continue to expand our
alternative risk offerings and our wholesale employee benefits specialty.
Build the most comprehensive international delegated authority business: We believe that both M&A
consolidation and panel consolidation have a long runway for Binding Authority. We believe that both M&A consolidation
and the use and reliance on scaled delegated Underwriting Management will continue to grow. National scale in E&S
distribution, underwriting expertise, and broad access to carrier capacity are key to building a cohesive binding authority
platform. With a nationally scaled binding authority operation, as well as the capabilities existing within our Underwriting
Management Specialty, we expect to be able to comprehensively address the opportunities in the delegated authority
market, which represented 31% of E&S premiums in 2024 according to AM Best.
Invest in operations, invest in growth: We have heavily invested in building a durable business that is able to
adapt to the continuously evolving E&S market. These investments include core operational functions, ongoing new hire
efforts, a visionary management team, and a robust acquisition integration effort. In addition, we have amassed a large
underlying data set based on the over 1.25 million total policies bound annually. We expect to leverage this data set to
further refine our pricing models, enhance our placement advice, and increase our efficiency. Even while deliberately
making these investments, we have been able to generate substantial cash flow and drive operating leverage. We have
historically used our cash flow to invest in the business, fund acquisitions, service our debt, and fund dividends. We expect
to continue fortifying our platform to support future expansion and sustain significant organic growth.
Our Specialties
Wholesale Brokerage
Our Wholesale Brokerage Specialty is primarily focused on specialty insurance products that retail brokers and
carriers have difficulty placing and distributing on their own due to the unique nature or size of the risk. Our Wholesale
Brokerage professionals are creative and highly skilled problem solvers, assisting retail insurance brokers in crafting
customized solutions. We pride ourselves on providing strategic advice, from coverage strategy and conception all the way
through claims activity. To achieve optimal client outcomes, our professionals utilize both their expertise and our leading
capabilities and resources. For the year ended December 31, 2025, our Wholesale Brokerage Specialty generated $1,600.4
million in net commission and fees, representing 53.4% of our total net commission and fees. Wholesale Brokerage
operates predominantly under the brand “RT Specialty.”
Our wholesale brokers distribute a wide range and diversified mix of specialty insurance products from
insurance carriers to retail insurance brokerage firms. Our largest distribution channels include (among others):
•Property coverages: Real Estate (Condos, Vacant Property), Catastrophic Exposures (Coastal Wind,
Flood, Wildfire, Earthquake, Terrorism), Specialized Coverage (Deductible Buy-Backs, Large Deductible
Placements), Builder’s Risk, Distribution / Warehousing, Group Programs, and Healthcare Risks.
•Casualty coverages: Construction (Project Specific, Residential and Commercial Contractor), Real Estate
(Habitational / OL&T / Lessors Risk), Life Sciences, Healthcare, Environmental, Primary and Excess Auto,
Political Risks, Product Liability / Manufacturing Risks, Hospitality / Liquor Liability, and Public Entities.
•Professional & Executive Liability coverages: Private Company Management Liability, Public Company
Directors and Officers Liability, Financial Institutions Management Liability, Not-For-Profit Organization
Management Liability, Crime / Kidnap / Ransom, Privacy Liability and Network Security, Errors and
Omissions Liability, and Medical Professional Liability.
•Transportation coverages: Local and Long-Haul Trucking, Haz-Mat Haulers, Contractors Fleets, Home
Delivery, Non-Emergency Medical Transport, Waste Haulers, and Auto Haulers.
10
•Personal Lines coverages: Homeowners (Condo Unit Owner, Contents In-Storage, High Value
Homeowners, Home-Based Business Product, Manufactured Homes), Farm & Ranch, Flood, and
Recreational (Collector Vehicle, All Terrain, Snowmobile, Watercraft).
Our Wholesale Brokerage Specialty has extensive relationships with blue-chip insurance carriers and retail
insurance brokers. With regard to entities that our Wholesale Brokerage Specialty has a relationship with, there are no
material concentrations in retail insurance brokers (top five: 25.2% of 2025 revenue), insurance carriers (top five: 20.6% of
2025 revenue - excluding all Lloyd’s syndicates combined), or internal Producers (top five: 16.1% of 2025 revenue). These
concentration statistics reflect both Wholesale Brokerage and Binding Authority Specialties, as many producers utilize both
placement strategies. During 2025, we conducted business with thousands of retail brokerage firms, including all of the 100
largest United States retail brokers as identified by Business Insurance in 2024. We also work with small- to mid-size retail
brokerage firms that do not have direct access to certain of the insurance carriers with which we do business. We continue
to benefit from the consolidation of wholesale broking relationships by many retail brokers due to our expertise, execution,
and absence of conflicts with most retail brokers’ core businesses.
Binding Authority
We believe our Binding Authority Specialty to be among the largest binding authority platforms in the nation.
For the year ended December 31, 2025, our Binding Authority Specialty generated $370.2 million in net commission and
fees, representing 12.4% of our total net commission and fees. Our Binding Authority Specialty also operates under the
brands “RT Specialty” and “RT Binding Authority.”
Our Binding Authority Specialty provides timely and secure access to our carrier trading partners that have
granted relatively limited delegated underwriting authority to us through our in-house binding agreements. Much of this
business comprises larger-volume, smaller-premium policies with well-defined underwriting criteria that allows us to
combine swift turnaround with the authority to secure coverage regardless of the complexity of risk. The ability to quickly
process higher volume policies endows us with a significant efficiency advantage over our competitors attempting to
individually place each risk.
Our Binding Authority Producers distribute a broad scope of insurance solutions to our retail agent and broker
trading partners. Our industry distribution channels include (among others):
•General Liability: Manufacturing, Contractors, Habitational, Hospitality, Building Owners and Lessors,
Sales / Service, and Special Events.
•Property: Vacant, Coastal, Distressed, Wildfire Exposed, Warehouse, Habitational, and Difference in
Condition.
•Transportation: Primary and Excess Auto Liability, Business Auto & Public Auto, Auto Physical
Damage, Trailer Interchange, and Contingent Liability and Cargo.
•Other: Workers’ Compensation, Liquor Liability, Farm and Ranch, Builder’s Risk, Inland Marine, Motor
Truck Cargo, and Crime.
Underwriting Management
Our Underwriting Management Specialty offers insurance carriers cost-effective, specialty market expertise in
distinct and complex market niches underserved in today’s marketplace through MGAs and MGUs, which act on behalf of
insurance carriers that have given us relatively broad authority to underwrite and bind coverage, as well as critical product
design, administrative and distribution responsibilities, for specific risks, and (often proprietary) National Programs that
offer commercial and personal insurance for specific product lines or industry classes. Professionals in the Underwriting
Management Specialty often have a meaningful percentage of their compensation tied to underwriting performance to align
interests with those of our carrier trading partners. In 2024 and 2025, we completed agreements for the acquisition of
entities or assets of eleven companies that significantly increased our MGA/MGU footprint internationally and added to
our MGA/MGU and National Programs offerings and capabilities domestically. For the year ended December 31, 2025,
our Underwriting Management Specialty generated $1,024.0 million in net commission and fees, representing 34.2% of our
total net commission and fees.
11
Our Underwriting Management Specialty operates under multiple brands, which are collectively referred to as
“Ryan Specialty Underwriting Managers.”

Our Organizational Structure
The Company is the sole managing member of New LLC. New LLC was formed as a Delaware limited liability
company on April 20, 2021, for the purpose of becoming, subsequent to our IPO, an intermediate holding company
between Ryan Specialty Holdings, Inc., and Ryan Specialty, LLC. Pursuant to contribution agreements, on September 30,
2021, the Company, the non-controlling interest LLC Unitholders and New LLC exchanged equity interests in Ryan
12
Specialty, LLC for LLC Common Units in New LLC, with the intent that New LLC be the new holding company for Ryan
Specialty, LLC interests. As Ryan Specialty, LLC is substantively the same as New LLC, for the purpose of this document
we will refer to both New LLC and Ryan Specialty, LLC as the “LLC.”
Our Recent Acquisitions
On February 3, 2025, the Company completed the acquisition of Velocity Risk Underwriters, LLC, an MGU
specializing in first-party insurance coverage for catastrophe exposed properties, based in Nashville, Tennessee.
On May 1, 2025, the Company completed the acquisition of USQRisk Holdings, LLC, a company that
underwrites, structures, prices, and places specialty insurance for corporate clients seeking bespoke, multi-year risk
solutions based in New York and London.
On May 16, 2025, the Company completed the acquisition of 360° Underwriting, an MGU specializing in
commercial construction, based in Dublin and Galway, Ireland.
On July 1, 2025, the Company completed the acquisition of certain assets of J.M. Wilson Corporation, a
binding authority and surplus lines broker specializing in transportation insurance, headquartered in Portage, Michigan.
On December 1, 2025, the Company completed the acquisition of Stewart Specialty Risk Underwriting Ltd., an
MGU specializing in underwriting large-account, high-hazard property and casualty solutions, based in Toronto, Canada.
Seasonality
Our Wholesale Brokerage, Binding Authority, and Underwriting Management Specialties typically experience
higher revenues in the second and fourth calendar quarters of each year, primarily due to the timing of policy renewals.
Clients
The insureds served by our clients operate in many businesses and industries throughout the United States, the
United Kingdom, Europe, Canada, and certain other countries in which our subsidiaries operate. Our clients are retail
brokers and agents, other intermediaries, and insurance carriers. The top five retail brokers in the United States account for
23.2% of our revenue, and no single retail broker accounted for more than 8.8% of total revenue in 2025. No carrier
accounted for more than 6.1% of total revenue in 2025 (excluding all Lloyd’s syndicates combined).
Tax Receivable Agreement
At the time of our IPO, we entered into a Tax Receivable Agreement with current and certain former LLC
Unitholders. The Tax Receivable Agreement provides for the payment by us to the current and certain former LLC
Unitholders, collectively, of 85% of the net cash savings, if any, in U.S. federal, state, and local income taxes that we
actually realize (or in some circumstances are deemed to realize) as a result of (i) certain increases in the tax basis of assets
of the LLC and its subsidiaries resulting from purchases or exchanges of LLC Common Units (“Exchange Tax Attributes”),
(ii) certain tax attributes of the LLC and its subsidiaries that existed prior to the IPO (“Pre-IPO M&A Tax Attributes”), (iii)
certain favorable “remedial” partnership tax allocations to which we become entitled (if any), and (iv) certain other tax
benefits related to our entering into the Tax Receivable Agreement, including certain tax benefits attributable to payments
that we make under the Tax Receivable Agreement (“TRA Payment Tax Attributes” and collectively with Exchange Tax
Attributes and Pre-IPO M&A Tax Attributes, the “Tax Attributes”).
The rights of the current and certain former LLC Unitholders under the Tax Receivable Agreement are
assignable. We expect to benefit from the remaining 15% of the tax benefits, if any, that we may actually realize. The
actual Tax Attributes, as well as any amounts paid to the current and certain former LLC Unitholders under the Tax
Receivable Agreement, will vary depending on a number of factors, including the timing of any future exchanges, the price
of shares of our Class A common stock at the time of any future exchanges, the extent to which such exchanges are taxable,
and the amount and timing of our income and applicable tax rates. The payment obligations under the Tax Receivable
Agreement are obligations of Ryan Specialty Holdings, Inc., and not of the LLC. The Tax Receivable Agreement provides
that if (i) certain mergers, asset sales, other forms of business combination, or other changes of control were to occur or (ii)
we breach any of our material obligations under the Tax Receivable Agreement, then the Tax Receivable Agreement will
terminate and our obligations, or our successor’s obligations, to make payments under the Tax Receivable Agreement
would accelerate and become immediately due and payable. The amount due and payable in that circumstance is based on
13
certain assumptions, including an assumption that we would have sufficient taxable income to fully utilize all potential
future tax benefits that are subject to the Tax Receivable Agreement.
Intellectual Property
We rely on a combination of copyright, trademark, trade dress, and trade secret laws in the United States and
other jurisdictions, as well as confidentiality procedures and contractual restrictions, to establish and protect our intellectual
property and proprietary rights. These laws, procedures, and restrictions provide only limited protection.
We have trademarks in the United States for “Ryan Specialty” and “RT Specialty.” The logo design for RT
Specialty, and numerous of our other brand names and logos, are registered as trademarks in the United States and other
jurisdictions. We have also registered numerous internet domain names related to our business. Some of our most
important brand names are not yet registered, and we rely on common-law trademark protection to protect this intellectual
property.
We enter into agreements with our employees, contractors, clients, partners, and other parties with which we do
business to limit access to, and disclosure of, our proprietary information. We cannot assure that the steps we have taken
will be sufficient or effective to prevent the unauthorized access, use, copying, or the reverse engineering of our proprietary
information, including by third parties who may use our proprietary information to develop products and services that
compete with ours. Moreover, others may independently develop products or services that are competitive with ours or that
infringe on, misappropriate, or otherwise violate our intellectual property and proprietary rights, and policing the
unauthorized use of our intellectual property and proprietary rights can be difficult. The enforcement of our intellectual
property and proprietary rights also depends on any legal actions we might bring against any such parties being successful,
but these actions are costly, time-consuming, and may not be successful, even when our rights have been infringed,
misappropriated, or otherwise violated.
Furthermore, effective copyright, trademark, trade dress, and trade secret protection may not be available in
every country in which our products are available, as the laws of some countries do not protect intellectual property and
proprietary rights to as great an extent as the laws of the United States. In addition, the legal standards relating to the
validity, enforceability, and scope of protection of intellectual property and proprietary rights are uncertain and still
evolving.
Companies in the insurance industry may own large numbers of copyrights, trademarks, and other intellectual
property and proprietary rights, and these companies and entities have and may in the future request license agreements,
threaten litigation or file suit against us based on allegations of infringement, misappropriation, or other violations of their
intellectual property and proprietary rights.
See “Risk Factors — Risks Related to Legal, Regulatory and Intellectual Property Issues” included elsewhere
in this annual report for a more comprehensive description of risks related to our intellectual property.
Regulation
Licensing
Our business activities are subject to licensing requirements and extensive regulation under the laws of the
countries, provinces, and states in which we operate. Regulatory authorities in the jurisdictions in which our operating
subsidiaries conduct business may require individual or company licensing to act as producers, brokers, agents, third-party
administrators, managing general agents, reinsurance intermediaries, or adjusters.
Under the laws of most states in the United States, Canadian Provinces, and most foreign countries, regulatory
authorities have relatively broad discretion with respect to granting, renewing, and revoking the licenses of producers,
brokers, and agents to transact business in such jurisdiction. The operating terms may vary according to the licensing
requirements, which may require that a firm operate in the jurisdiction through a local corporation. Our subsidiaries must
comply with laws and regulations of the jurisdictions in which they do business. These laws and regulations are enforced
by federal and state agencies in the United States. In the United Kingdom, some subsidiaries are regulated by governmental
agencies including the Financial Conduct Authority with additional licensing and regulatory oversight from the Lloyd’s
insurance market.
14
Excess and Surplus Compliance
The U.S. E&S market generally provides insurance for businesses that are unable to obtain coverage from
Admitted insurance carriers because of their high or complex risk profile or the unique nature or size of the risk. The
surplus lines transaction is facilitated through a licensed and regulated surplus lines broker. It is the licensed surplus lines
broker that is responsible for: (i) selecting an eligible surplus lines insurer; (ii) reporting the surplus lines transaction to
insurance regulators; (iii) remitting the premium tax due on the transaction to state tax authorities; and (iv) assuring
compliance with all the requirements of the surplus lines codes. In most states, surplus lines laws, or laws pertaining to
non-admitted insurance business, require that an insured undertake a diligent search for insurance coverage from the
admitted market prior to securing coverage from a surplus lines insurer. State laws also require surplus lines brokers to
comply with exempt commercial purchaser laws and affidavit/document filing requirements, as well as requiring the
collection and paying of any taxes, stamping fees, assessment fees, and other applicable charges on such business. Surplus
Lines brokers are often subject to special licensing, surplus lines tax, and/or due diligence requirements by the home state
of the insured. Fines for failing to comply with these Surplus Lines requirements, specifically for failing to comply with the
surplus lines licensing or due diligence requirements, vary by state but can range to several hundred thousand dollars.
Fiduciary Funds
Insurance authorities in the United States, the United Kingdom, and certain other jurisdictions in which our
subsidiaries operate have also enacted laws and regulations governing the retention and investment of funds, such as
premiums, claims proceeds, and premium taxes, held in a fiduciary capacity for others. These laws and regulations, as well
as certain contractual arrangements with some of our carrier trading partners, generally require the segregation of these
fiduciary funds and limit the types of investments that may be made with them.
Broker Compensation
Some U.S. states permit insurance agents and brokers to charge policy fees, while other states limit or prohibit
this practice. Many states regulate to some degree the fees that may be charged by brokers and most states impose a broker
compensation disclosure requirement. In the U.K., there are regulatory requirements in relation to the conduct of insurance
business (which may vary depending on business type), including in relation to the fair treatment of customers and acting
in their best interests, disclosure of commissions, and soliciting or accepting inducements. Firms may be fined for non-
compliance and claims/complaints may be brought by private parties.
Privacy and Cybersecurity
Our businesses are subject to various laws, rules, and regulations relating to the privacy of information
regarding clients, employees, and others.
U.S. Federal law and the laws of many states require financial institutions and entities involved in health care
insurance to protect the privacy and security of personal information. Many of these laws require notice about policies and
practices relating to collection and disclosure of personal information and regulate its retention, use, disclosure, and
disposal. Most states have adopted strict cybersecurity laws and regulations requiring that insurance agencies adopt security
standards to protect personal information and provide notification of cybersecurity incidents under certain circumstances.
In addition, we are also subject to laws granting individuals the right to access, amend, or delete their personal data.
Regulators and legislators have taken additional action to regulate artificial intelligence and automated decision-making
that uses personal information and affects individuals. Regulators are also expected to step up enforcement of existing
privacy law. A major revision to the Health Insurance Portability and Accountability Act security rule has been proposed
that, if adopted, would enhance the cybersecurity protections required for personal health information.
In the European Union, the General Data Protection Regulation (the “EU GDPR”) is the primary privacy law
applicable to our businesses. The EU GDPR imposes a range of compliance obligations relating to the collection, use, and
disclosure of personal information as well as providing individuals with certain rights about how their personal information
is processed. The U.K. has implemented various legislation focusing on data protection and privacy, including but not
limited to, the U.K. Data Protection Act 2018 and the U.K. GDPR which broadly aligns with the EU GDPR and provides
for extensive fines for noncompliance. Noncompliance with these laws could result in enforcement by government
regulators, who can impose financial penalties, as well as claims from private parties.
Competition
15
The wholesale brokerage, binding authority and underwriting management businesses are highly competitive
and very fragmented, although there are a limited number of truly national players. Our main competitors are national
insurance wholesale brokers, as well as numerous specialist, regional, and local firms in almost every area of our business.
We also compete with insurance and reinsurance carriers that market and service their insurance products without the
assistance of brokers or agents. Competition also comes from other businesses that do not fall into the categories above,
including commercial and investment banks and consultants that provide risk-related services and products.
Key competitive factors in our market include:
•expertise and intellectual capital;
•market access and/or product availability; and
•client service.
We believe that we compete favorably on these factors.
Human Capital Management
Our culture is the foundation of everything we do. Our employees are our greatest asset, and we strive to foster
a productive and empowering work environment that embodies our core values: Integrity, Client Centricity, Teamwork,
Meritocracy, Inclusion, Empowerment, Innovation, and Courage. Our key differentiators are not only our talent and
expertise but also the creativity and execution we deliver on behalf of our clients. Our commitment to attracting,
developing, and retaining top industry talent to assist our clients is matched only by our entrepreneurial spirit and passion
for excellence.
As of December 31, 2025, we employed approximately 6,110 people with 129 offices across the United States
and in the United Kingdom, Europe, Canada, Australia, the United Arab Emirates, India, and Singapore. We also engage
temporary employees and consultants and none of our employees are represented by unions. We offer competitive
compensation and benefits programs to attract and retain top talent. We have high employee engagement and ownership,
low turnover and consider our current relationship with our employees to be very good.
Culture and community are a priority for Ryan Specialty. We strive to promote an ecosystem that supports,
accepts, values, and promotes equality and inclusion. We safeguard and champion the health, safety, and wellbeing of our
employees and actively seek opportunities to support and serve our community. Our core values reflect a culture of
meritocracy that is inclusive and treats people equally. Every employee is recognized and assessed based on their
performance and contributions, which serves to fulfill our mission of hiring and retaining the top talent in our industry. We
strive to protect the invaluable attributes of meritocracy and are committed to purposefully reinforcing and refining every
aspect of our culture and values through various initiatives that enable our firm to reap the vast benefits that are inherent in
a diverse and inclusive environment. Our values set the foundation for a workplace where people can be their best self and
do their best work. Ryan Specialty rewards top performers and harnesses our differences and similarities to better serve our
clients, trading partners, teammates, and communities.
The attraction, development, and retention of employees is a critical factor in our success. As a result, we
provide training and development programs for our newest teammates, that embed teaching of our core values, along with
those essential critical elements of building an inclusive environment. Our training approach is critical for our future
growth and ability to recruit and develop the best of the best. We also partner with a number of nonprofit, community, and
industry organizations to attract, support, develop, and retain diverse talent.
Availability of SEC Filings
Our internet address is www.ryanspecialty.com. We are subject to the informational requirements of the
Exchange Act and, in accordance therewith, we file annual, quarterly, and current reports and other information with the
SEC. Copies of our reports on Forms 10-K, 10-Q, 8-K, and all amendments to those reports filed with the SEC, and any
reports of beneficial ownership of our Common Stock filed by executive officers, directors, and beneficial owners of more
than 10% of our outstanding common stock are posted on, and may be obtained through, our investor relations website,
ir.ryanspecialty.com, or may be requested in print, at no cost, by email at ir@ryanspecialty.com or by mail at Ryan
Specialty Holdings, Inc., 155 North Wacker Drive, Suite 4000, Chicago, Illinois 60606, Attention: Investor Relations.
16
ITEM 1A. RISK FACTORS
Our operating and financial results are subject to various risks and uncertainties. The risks and uncertainties
described below are not the only ones we face. Additional risks and uncertainties that we are unaware of, or that we
currently believe are not material, may also become important factors that affect us. If any of the following risks occur, our
business, financial condition, operating results, and prospects could be materially and adversely affected. Because of the
following factors, as well as other factors affecting our businesses, financial condition, operating results, and prospects,
past financial performance should not be considered a reliable indicator of future performance, and investors should not
rely on historical trends to anticipate trends or results in the future.
Risk Factors Summary
Our business is subject to numerous risks and uncertainties and you should carefully consider all the
information presented in the section entitled “Risk Factors” in this Annual Report. Some of the principal risks related to our
business include the following:
Risks Related to Our Business and Industry
•our failure to successfully recruit and retain our senior management team, revenue producers, or other key
employees and to successfully plan and prepare for the succession of our senior management team;
•the potential loss of our relationships with insurance carriers or our clients, failure to maintain good
relationships with insurance carriers or clients, becoming dependent upon a limited number of insurance
carriers or clients or the failure to develop new insurance carrier and client relationships;
•errors in, or ineffectiveness of, our underwriting models and the impact to our reputation and relationships
with insurance carriers, retail brokers, and agents;
•failure to maintain, protect, and enhance our brand or prevent damage to our reputation;
•the unsatisfactory evaluation of potential acquisitions or the failure to successfully integrate acquired
businesses and/or introduce new products, lines of business, and/or markets;
•our inability to successfully recover upon experiencing a disaster or other interruption in business
continuity;
•the impact of third parties that perform key functions of our business operations acting in ways that harm
our business;
•failure to maintain the valuable aspects of our Company’s culture;
•the cyclicality of, and the economic conditions in, the markets in which we operate and conditions that
result in reduced insurer capacity or a migration of business away from the E&S market and into the
Admitted market;
•a reduction in insurer capacity to adequately and appropriately underwrite risk and provide coverage;
•our international operations expose us to various international risks, including required compliance with
evolving legal and regulatory obligations, that are different, and at times more burdensome, than those set
forth in the United States;
•changes in interest rates and deterioration of credit quality could reduce the value of our cash balances or
interest income;
•significant competitive pressures in each of our businesses;
•decreases in premiums or commission rates set by insurers, or actions by insurers seeking repayment of
commissions;
•the impact if the contracts that govern our MGAs or MGUs are terminated or changed;
•a decrease in the amount of supplemental or contingent commissions we receive;
•our inability to collect our receivables;
•disintermediation within the insurance industry and shifts away from traditional insurance markets;
•impairment of goodwill and intangibles;
17
•the challenges with properly assessing, adapting to, and managing the adoption and use of artificial
intelligence and other evolving technologies;
•the inability to maintain strong growth and generate sufficient revenue to maintain profitability;
•the loss of clients or business as a result of consolidation within the retail insurance brokerage industry;
•the inability to achieve the intended results of our restructuring program;
•significant investment in our growth strategy and whether expectation of internal efficiencies are realized;
•the unavailability or inaccuracy of our clients’ and third parties’ data for pricing and underwriting insurance
policies;
•the competitiveness and cyclicality of the reinsurance industry;
•the occurrence of natural or man-made disasters;
•the impact on our operations and financial condition from the effects of a pandemic or the outbreak of a
contagious disease and resulting governmental and societal responses;
•the economic and political conditions of the countries and regions in which we operate;
•the failure, or take-over by the FDIC, of one of the financial institutions that we use;
•our inability to respond quickly to operational or financial problems or promote the desired level of
cooperation and interaction among our offices;
•our international operations expose us to various international risks, including exchange rate fluctuations;
•changing expectations over corporate responsibility and stakeholder interests;
Risks Related to Intellectual Property, Data Privacy, and Cybersecurity
•the impact of breaches in security that cause significant system or network disruption or business
interruption;
•the impact of improper disclosure of confidential, personal, or proprietary data, misuse of information by
employees or counterparties, or as a result of cyber incidents and cyberattacks;
•our inability to gain internal efficiencies through the application of technology, or effectively apply
technology in driving value for our clients, or the failure of technology and automated systems to function
or perform as expected;
•the impact of infringement, misappropriation, or dilution of our intellectual property;
•the impact of the failure to protect our intellectual property rights, or allegations that we have infringed on
the intellectual property rights of others;
Risks Related to Legal and Regulatory Issues
•the impact of evolving governmental regulations, legal proceedings, and governmental inquiries related to
our business;
•being subject to E&O claims, as well as other contingencies and legal proceedings;
•our handling of client funds and surplus lines taxes that exposes us to complex fiduciary regulations;
•changes in tax laws or regulations;
•decreased commission revenues due to proposed tort reform legislation;
•the impact of regulations affecting insurance carriers;
Risks Related to Our Indebtedness
•our outstanding debt potentially adversely affecting our financial flexibility and subjecting us to contractual
restrictions and limitations that could significantly affect our ability to operate and manage our business;
•not being able to generate sufficient cash flow to service all of our indebtedness and being forced to take
other actions to satisfy our obligations under such indebtedness;
•being affected by further changes in the U.S. based credit markets;
18
•changes in our credit ratings;
Risks Related to Our Organizational Structure and our Class A Common Stock
•risks related to the payments required by our Tax Receivable Agreement;
•risks relating to our organizational structure that could result in conflicts of interests between the LLC
Unitholders, the Ryan Parties, and the holders of our Class A common stock; and
•risks relating to our share repurchase program.
These and other risks are more fully described below. If any of these risks actually occurs, our business,
financial condition, results of operations, cash flows, and prospects could be materially and adversely affected.
Risks Related to Our Business and Industry
If we fail to successfully recruit and retain our management team, revenue producers, including wholesale brokers and
underwriters, and other key employees, and plan and prepare for the succession of our senior management, we may not
be able to execute our business strategy.
Our success depends on our ability to attract, retain, and develop skilled and experienced personnel. There is
significant competition within the insurance industry and from businesses outside the industry for exceptional employees,
especially in key positions. If we are not able to successfully attract, retain, develop, and motivate our employees, and plan
and prepare for the succession of our senior management, our business, financial results, and reputation could be materially
and adversely affected. Our success and future performance depend in part upon the continued services of our executive
officers, senior management, and other highly skilled personnel. In 2024, we effectuated our management transition plan
involving our Chief Executive Officer, President, and Chief Financial Officer. Effective management of future succession
planning, including succession plans for our current CEO and other senior management positions, is important for the
continued success of the Company. Inadequate succession planning, and the execution thereof, could have an adverse
effect on our business, results of operations, financial condition, and liquidity.
The loss of personnel who manage important client and carrier relationships for our products could adversely
affect our operations and execution of our future growth strategies. Competition for revenue producers including wholesale
brokers and underwriters is intense. Our ability to recruit and retain these professionals is critical to the success of our
business. We cannot provide assurance that any of the wholesale brokers or underwriters who leave our firm will comply
with the provisions of their employment and stock grant agreements that preclude them from competing with us or
soliciting our clients and employees, or that these provisions will be enforceable under applicable law or sufficient to
protect us from the loss of any business.
The law governing non-compete agreements and other forms of restrictive covenants varies from state to state
with some states permitting very limited use of non-compete and other restrictive covenants and others allowing greater
degrees of enforceability of the types of restrictive covenants, and forfeiture and clawback clauses, we utilize. At the
federal level, the future legal landscape regarding non-competes is uncertain. In April 2024, the Federal Trade Commission
(“FTC”) finalized a rule broadly prohibiting the use of non-compete clauses, with limited exceptions for existing non-
competes for senior executives. Although the rule was set to take effect in September 2024, federal courts enjoined its
enforcement shortly before implementation. Following the 2024 U.S. presidential election, the new presidential
administration halted appeals of these rulings and signaled a departure from the prior administration’s position. As a result,
the FTC’s finalized rule broadly prohibiting most non-compete clauses is not currently in effect, and its future remains
uncertain. As a result, there is ongoing uncertainty regarding the future enforceability of non-compete agreements with
employees in the United States. If future legislation, judicial decisions, or regulatory actions further limit or invalidate the
use of non-compete agreements, our ability to prevent former employees from using their knowledge of our business and
operations to compete with us could be limited.
Our business may be harmed if we lose our relationships with retail brokers, insurance carriers, or other trading
partners, we fail to maintain good relationships with retail brokers, insurance carriers, or other trading partners, we
become dependent upon a limited number of retail brokers, insurance carriers, or other trading partners or we fail to
develop new retail broker, insurance carrier, or other trading partner relationships.
Our business typically enters into contractual relationships with insurance carriers, retail brokers, and other
trading partners that are sometimes unique to us, but nonexclusive and terminable on short notice by either party for any
reason. In many cases, insurance carriers also have the ability to amend the terms of our agreements unilaterally on short
notice.
19
Insurance carriers may be unwilling to allow us to sell their existing or new insurance products or may amend
our agreements with them, for a variety of reasons, including for competitive or regulatory reasons or because of a
reluctance to distribute their products through our platform. Insurance carriers may decide to rely on their own internal
distribution channels, choose to exclude us from their most profitable or popular products, or decide not to distribute
insurance products in individual markets in certain geographies or altogether. The termination or amendment of our
relationship with an insurance carrier could reduce the variety of insurance products we offer or our ability to place
coverage for certain risks for which we do not have alternative markets. We also could lose a source of, or be paid reduced
commissions for, future sales and could lose renewal commissions for past sales. Our business could also be harmed if we
fail to develop new insurance carrier relationships.
Similarly, retail brokers and other trading partners could develop their own wholesale distribution channels or
choose to work with wholesale distributors other than us. This could reduce the number of submissions we receive which
could result in reduced commissions. Our business could also be harmed if we fail to develop relationships with new retail
brokers or other sources of business.
Historically, wholesale brokers and other wholesale distributors have been involved in a very high percentage
of risks placed in the E&S market. In addition to the potential for retail brokers developing their own wholesale distribution
channels or choosing to work with wholesale distributors other than us, retail brokers often might prefer to place business
directly with insurance carriers, without the involvement of a wholesaler. There is a risk to our business that insurance
carriers will accommodate the retail broker’s preference to place business directly with the E&S insurer rather than through
a wholesale broker or other wholesale distributor.
In the future, we may have a reduced number of insurance carriers or retail brokers with which we trade or
derive a greater portion of our commissions and fees from a more concentrated number of insurance carriers, retail brokers
or other trading partners as our business and the insurance industry evolve. The top five insurance carriers (excluding all
Lloyd’s syndicates combined) for which we place business represented an aggregate of 20.6% and 20.9% of our revenues
for the years ended December 31, 2025 and 2024, respectively. The top five retail brokers with which we place business
represented 25.2% and 26.9% of our revenues for the years ended December 31, 2025 and 2024, respectively. Should our
dependence on a smaller number of insurance carriers, retail brokers or other trading partners increase, whether as a result
of the termination of relationships, consolidation or otherwise, we may become more vulnerable to adverse changes in our
relationships with these counterparties, particularly in states where we offer insurance products from a relatively small
number of insurance carriers or where a small number of insurance companies or retail brokers dominate a geographic area,
lines of business, or market segment. The termination, amendment or consolidation of our relationships with our insurance
carriers could harm our business, financial condition, and results of operations.
We depend, to a large extent, on our relationships with all of our trading partners and our reputation for high-
quality advice and solutions. If a trading partner is not satisfied with our services, it could cause us to incur additional costs
and impair profitability. Many of our clients are businesses that band together in industry groups or trade associations and
actively share information among themselves about the quality of service they receive from their vendors. Accordingly,
poor service to one client may negatively impact our relationships with multiple other clients or potential clients.
Moreover, if we fail to meet our contractual obligations, we could be subject to legal liability or loss of client relationships.
If our underwriting models contain errors or are otherwise ineffective or our underwriters do not demonstrate sufficient
skill, our reputation and relationships with insurance carriers, retail brokers, and agents could be harmed.
Our ability to attract insurance carriers, retail brokers, and agents to our MGAs and MGUs, programs, and
binding authority operations is significantly dependent on our ability to effectively evaluate risks in accordance with
insurer underwriting guidelines. Our business depends significantly on the accuracy and success of our underwriting
models and the skill of our underwriters. To conduct this evaluation, we use proprietary underwriting models and third-
party tools. If our underwriters do not perform with the expected level of skill, any of the models or tools that we use are
ineffective or contain programming or other errors, the data provided by clients or third parties is incorrect or stale, or if we
are unable to obtain accurate data from clients or third parties our pricing and approval process could be negatively
affected, resulting in potential violations of underwriting authority and loss of business. This could damage our reputation
and relationships with insurance carriers, retail brokers, and agents which could harm our business, financial condition, and
results of operations.
20
Damage to our reputation could have a material adverse effect on our business and we are subject to economic and
reputational harm if companies with which we do business engage in negligent, grossly negligent, misleading, or
fraudulent behavior.
Our ability to attract and retain clients, employees, investors, insurer trading partners, and other capital is highly
dependent upon the subjective external perceptions of our level of service, trustworthiness, business practices, financial
condition, and other qualities. Negative perceptions or publicity regarding these matters could erode trust and confidence
and damage our reputation among existing and potential clients, which in turn could make it difficult for us to maintain
existing clients and attract new ones. Damage to our reputation due to a failure to proactively communicate to stakeholders
changes in strategy and business plans could further affect the confidence that our clients, regulators, creditors, investors,
insurer trading partners, and other parties that are important to our business have in us, which could have a material adverse
effect on our business, ability to raise capital, financial condition, and results of operations.
As part of our role in distributing insurance products and services, we rely upon trusted trading partners to
provide risk-bearing insurance capital, collect and transmit funds, and to provide other products and services. If one or
more of these trading partners, whether negligently or intentionally, fails to provide the risk-bearing insurance capital as
agreed, mishandles or misappropriates funds, or otherwise fails to properly provide products and services as expected, we
face potential liability for damages, and reputational harm, which could harm our business, financial condition, and results
of operations. During 2022, the Company placed certain insurance policies through a trading partner with the
understanding that the policies were underwritten by highly rated insurance capital. The policies were instead underwritten
by an insurance carrier that was not considered satisfactory by the Company or the insureds. The Company committed to
securing replacement coverage, to the extent commercially available, from highly rated insurance companies on terms
substantially similar to the insurance coverage originally agreed upon. As a result of this unusual circumstance, the
Company incurred losses arising from the original placements. For additional discussion, see “Note 15, Commitments and
Contingencies” in the footnotes to the consolidated financial statements in this Annual Report.
Our business depends on a strong brand, and any failure to maintain, protect, and enhance our brand would hurt our
ability to grow our business, particularly in new markets where we have limited brand recognition.
We have developed a strong brand that we believe has contributed significantly to the success of our business.
Maintaining, protecting, and enhancing the Ryan Specialty brand is critical to growing our business, particularly in new
markets where we have limited brand recognition. If we do not successfully build and maintain a strong brand, our business
could be materially harmed. Maintaining and enhancing the quality of our brand may require us to make substantial
investments in areas such as marketing, community relations, outreach, and employee training. We actively engage in
advertisements, targeted promotional mailings and email communications, and engage on a regular basis in public relations
and sponsorship activities. These investments may be substantial and may fail to encompass the optimal range of
traditional, online, and social advertising media to achieve maximum exposure and benefit to the brand.
Our business strategy includes plans to continue to make acquisitions and we face risks associated with the evaluation
of potential acquisitions, the integration of acquired businesses, and the introduction of new products, lines of business,
geographies, and markets.
As part of our business strategy, we have made, and intend to continue to make, acquisitions, including
acquisitions in lines of business that are natural adjacencies. The success of our acquisition strategy is dependent upon our
ability to identify appropriate acquisition targets, negotiate transactions on favorable terms, complete transactions, have
adequate access to financing on acceptable terms, and successfully integrate them into our existing businesses.
If acquisitions are made, we may not realize the anticipated benefits of such acquisitions, including, but not
limited to, revenue growth, operational efficiencies, or expected synergies. Many of the businesses and assets that we have
acquired or may acquire have unaudited historical financial statements or records that have been, or will be, prepared by
the management of such companies and have not been, or will not be, independently reviewed or audited. We cannot be
certain that the financial statements or records of companies or assets we have acquired or may acquire would not, or will
not, be materially different if such statements were independently reviewed or audited. If such statements were to be
materially different, the tangible and intangible assets we acquire may be more susceptible to impairment charges, which
could have a material adverse effect on us.
In addition, many of the businesses that we acquire and develop will likely have smaller scales of operations
prior to integration into the Company. If we are not able to manage the growing complexity of these businesses, including
improving, refining, or revising our systems and operational practices, enlarging the scale and scope of the businesses, and
integrating the new business into our culture and operations, our business may be adversely affected. Many of these
21
companies may not have robust controls, procedures, and policies typical of a U.S. based public company, in particular,
with respect to the effectiveness of cyber and information security practices and incident response plans, which creates a
risk following acquisition and prior to the completion of integration.
From time to time, either through acquisitions or internal development, we enter new distribution channels,
geographies, or lines of business or offer new products and services within existing lines of business. These new
distribution channels, lines of business, or new products and services present additional risks, particularly in instances
where the markets are not fully developed. Such risks include the investment of significant time and resources to recruit,
hire, and retain personnel and develop the products, the risks involved with the management of the integration process and
development of new processes and systems to accommodate complex programs, and the risk of financial guarantees and
additional liabilities associated with these efforts.
Failure to manage these risks arising from acquisitions or development of new businesses could materially and
adversely affect our business, results of operations, and financial condition.
Our inability to successfully recover should we experience a disaster or other business continuity problem could cause
material financial loss, loss of human capital, regulatory actions, reputational harm, or legal liability.
Our operations are dependent upon our ability to protect our personnel, offices, and technology infrastructure
against damage from business continuity events that could have a significant disruptive effect on our operations. Should we
experience a local or regional disaster or other business continuity problem, such as a security incident or attack, a natural
disaster, climate event, terrorist attack, civil unrest, pandemic, power loss, telecommunications failure, or other natural or
man-made disaster, our continued success will depend, in part, on the availability of our personnel and office facilities, and
the proper functioning of computer systems, telecommunications, and other related systems and operations. In events like
these, while our operational size, the multiple locations from which we operate, and our existing backup systems provide us
with some degree of flexibility, we still can experience near-term operational challenges in particular areas of our
operations. We could potentially lose access to key executives, personnel, or client data or experience material adverse
interruptions to our operations or delivery of services to our clients in a disaster recovery scenario. A disaster on a
significant scale or affecting certain of our key operating areas within or across regions, or our inability to successfully
recover should we experience a disaster or other business continuity problem, could materially interrupt our business
operations and cause material financial loss, loss of human capital, regulatory actions, reputational harm, damaged client
relationships, or legal liability. We have certain disaster recovery procedures in place and insurance to protect against such
contingencies. However, such procedures may not be effective and any insurance or recovery procedures may not continue
to be available at reasonable prices and may not address all such losses.
We rely on third parties to perform key functions of our business operations enabling our provision of services to our
clients. These third parties may act in ways that could harm our business.
We rely on third parties, and in some cases subcontractors, to provide services, data, and information, such as
technology, information security, funds transfers, data processing, support functions, and administration that are critical to
the operations of our business. These third parties include correspondents, agents and other brokerage and intermediaries,
insurance markets, data providers, plan trustees, transaction processors, IT service providers, payroll service providers,
benefits administrators, software and system vendors, health plan providers, and providers of human resources, among
others. As we do not fully control the actions of these third parties, we are subject to the risk that their decisions, actions, or
inactions may adversely impact us, and replacing these service providers could create significant delay and expense. A
failure by third parties to comply with service-level agreements or regulatory or legal requirements in a high-quality and
timely manner, particularly during periods of our peak demand for their services, could result in economic and reputational
harm to us. In addition, we face risks when we transition from in-house functions to third-party support functions and
providers that there may be disruptions in service or other unintended results that may adversely affect our business
operations. These third parties face their own technology, operating, business, and economic risks, and any significant
failures by them, including the improper use or disclosure of our confidential client, employee, or company information,
could cause harm to our business and reputation. An interruption in or the cessation of service by any service provider as a
result of systems failures, cybersecurity incidents, capacity constraints, financial difficulties, or for any other reason could
disrupt our operations, impact our ability to offer certain products and services, and result in contractual or regulatory
penalties, liability claims from clients or employees, damage to our reputation, and harm to our business.
If we cannot maintain the valuable aspects of our Company’s culture as we grow, our business may be harmed.
We believe that our Company’s culture, including our management philosophy, has been a critical component
of our success and that our culture creates an environment that drives and perpetuates our overall business strategy. We
22
have invested substantial time and resources in building our team and we expect to continue to hire aggressively and
increase our employee population as we expand in both the United States and internationally. As we grow and mature as a
public company and internationally, we may find it difficult to maintain valuable aspects of our Company’s culture.
Failure to preserve the valuable aspects of our culture could harm our future success, including our ability to
retain and recruit personnel, innovate and operate effectively, and execute on our business strategy. If we are unsuccessful
in recruiting, hiring, training, managing and integrating new employees, or retaining our existing employees or if we fail to
preserve the valuable aspects of our Company’s culture, it could materially impair our ability to service and attract new
clients, all of which would materially and adversely affect our business, financial condition, and results of operations.
We may be negatively affected by the cyclicality of and the economic conditions in the markets in which we operate.
Premium pricing within the commercial property and casualty insurance markets in which we operate has
historically been cyclical based on the underwriting capacity of the insurance carriers operating in this market, general
economic conditions, and other social, economic, and business factors. In a period of decreasing insurance capacity or
higher than typical loss ratios across an insurance segment or segments, insurance carriers may raise premium rates. This
type of market frequently is referred to as a “hard” market. In a period of increasing insurance capacity or lower than
typical loss ratios across an insurance segment or segments, insurance carriers may reduce premium rates and business
might migrate away from the E&S market (where we conduct most of our business) and into the Admitted market. This
type of market frequently is referred to as a “soft” market. Because our commissions usually are calculated as a percentage
of the gross premium charged for the insurance products that we place, and most of our business is transacted in the E&S
market, our revenues are affected by the cyclicality of the market. The frequency and severity of natural disasters, other
catastrophic events (such as hurricanes, wildfires, and pandemics), social inflation, and reductions or increases in insurance
capacity can affect the timing, duration, and extent of industry cycles for many of the product lines we distribute. It is very
difficult to predict the severity, timing, or duration of these cycles.
Economic downturns, volatility, or uncertainty in some markets may cause changes to insurance coverage
decisions by our clients, which may result in reductions in the growth of new business or reductions in existing business. If
our clients become financially less stable, enter bankruptcy, liquidate their operations, or consolidate our revenues and
collectability of receivables could be adversely affected. An increase in the number of insolvencies associated with an
economic downturn, especially insolvencies in the insurance industry, could adversely affect our business through the loss
of clients and insurance markets and by hampering our ability to place insurance business or by exposing us to E&O
claims.
If insurance intermediaries or insurance companies experience liquidity problems or other financial difficulties,
we could encounter delays in payments owed to us, which could harm our business, financial condition, and results of
operations.
Our business, and therefore our results of operations and financial condition, may be adversely affected by conditions
that result in reduced insurer capacity.
Our results of operations depend on the continued capacity of insurance carriers to adequately and appropriately
underwrite risk and provide coverage, which depends in turn on those insurance companies’ ability to procure reinsurance.
Capacity could also be reduced by insurance companies failing or withdrawing from writing certain coverages that we offer
to our clients. We have no control over these matters. To the extent that reinsurance becomes less widely available or
significantly more expensive, we may not be able to procure the amount or types of coverage that our clients desire and the
coverage we are able to procure for our clients may be too expensive or more limited than is acceptable.
Our international operations expose us to various international risks that could adversely affect our business.
Our operations are conducted in numerous locations and geographies including the United States, the United
Kingdom, Europe, Canada, India, and Singapore. Accordingly, we are subject to regulatory, legal, economic, and market
risks associated with operating in, and sourcing from, foreign countries, including the potential for:
•difficulties in staffing and managing our foreign offices, including due to unexpected wage inflation or job
turnover, and the increased travel, infrastructure, legal, regulatory, and compliance costs and risks
associated with multiple international locations;
•extensive and conflicting regulations in the countries in which we do business;
•imposition of investment requirements or other restrictions by foreign governments;
23
•longer payment cycles;
•greater difficulties in collecting accounts receivable;
•insufficient demand for our services in foreign jurisdictions;
•our ability to execute effective and efficient cross-border sourcing of services on behalf of our clients;
•the reliance on or use of third parties to perform services on our behalf;
•disparate tax regimes;
•more expansive legal rights of employees, including specifically those applicable to our international
operations;
•variations in protection of intellectual property and other legal rights;
•restrictions on the import and export of technologies; and
•trade tariffs and/or barriers.
Our performance can be affected by global economic conditions, as well as geopolitical tensions and other
circumstances with global reach. In recent years, concerns about the global economic outlook have adversely affected
economic markets and business conditions in general. Geopolitical tensions, such as Russia’s incursion into Ukraine,
tension among the United States, China, and other trading partners, conflict in the Middle East, supply chain issues,
economic sanctions, the volatility of oil prices, and heightened concerns about cyberattacks have, in general, adversely
affected economic markets and business conditions. Inflation and hyper-inflation have resulted in market volatility and
variable interest rates, increasing global tensions and uncertainty for global commerce, and instability in the global capital
markets and evolving U.S. tariff policy on goods imported from many countries have the potential to do the same.
Sustained or worsening of these and other global economic conditions and increasing geopolitical tensions may negatively
impact our business, financial condition, and results of operations.
Changes in interest rates and deterioration of credit quality could reduce the value of our cash balances or interest
income and adversely affect our financial condition or results.
Operating funds available for corporate use were $158.3 million and $540.2 million at December 31, 2025 and
2024, respectively, and are reported in Cash and cash equivalents. Funds held on behalf of clients and insurers were
$1,426.1 million and $1,140.6 million at December 31, 2025 and 2024, respectively, are reported in Fiduciary cash and
receivables on the Consolidated Balance Sheets, and are held in fiduciary bank accounts. We may experience reduced
investment earnings on our cash and short-term investments of fiduciary and operating funds within Fiduciary investment
income and Interest expense, net, respectively, if the yields on investments deemed to be low risk fall below their current
levels. On the other hand, higher interest rates could result in a higher discount rate used by investors to value our future
cash flows thereby resulting in a lower valuation of the Company. In addition, during times of stress in the banking
industry, counterparty risk can quickly escalate, potentially resulting in substantial losses for us as a result of our cash or
other investments with such counterparties, as well as substantial losses for our clients and the insurance companies with
which we work
We face significant competitive pressures in our business.
Wholesale brokerage, binding authority, underwriting management, and other intermediary and underwriting
and claims administration specialties are highly competitive. We believe that our ability to compete is dependent on the
quality of our people, service, product features, price, commission structure, financial strength, and the ability to access
certain insurance markets. We compete with a large number of national, regional, and local organizations. Additionally, the
industry in which we operate is dynamic and creates opportunities for, and pressure from, our competitors and trading
partners. For example, certain emerging industry trends in 2025 created additional opportunities for retail brokers to place
property coverage directly. New or increased competition as a result of these matters or regulatory or other industry
developments could harm our business, financial condition, and results of operations.
Underwriting Management and Binding Authority are dependent upon contracts between us and the insurance
carriers. Those contracts can, in many cases, be terminated by the insurance carrier with minimal advance notice.
Moreover, upon expiration of the contract term, insurance carriers may choose to let those agreements lapse or request
changes in the terms of the program, including the scope of our delegated authority or the amount of commission we
receive, which could reduce our revenues from the program.
24
Poor risk selection, failure to maintain robust pricing models, and failure to monitor claims activity could
adversely affect our ability to renew contracts or have the opportunity to develop new products with new or existing
insurance carriers. The termination of the services of our Specialties, or a change in the terms of any of these programs,
could harm our business and operating results, including the opportunity to receive contingent commissions.
Because the revenue we earn on the sale of certain insurance products is based on premiums and commission rates set
by insurers, any decreases in these premiums or commission rates, or actions by insurers seeking repayment of
commissions, could result in revenue decreases or expenses to us.
We derive revenue from commissions on the sale of insurance products to our retail and wholesale broker
clients that are paid by the insurance carriers from whom the insureds purchase insurance. In certain circumstances,
payments for the sale of insurance products are processed directly by insurance carriers, and therefore we may not receive a
payment that is otherwise expected in any particular period until after the end of that period, which can adversely affect our
ability to budget for significant future expenditures. Additionally, insurance carriers or their affiliates may under certain
circumstances seek the chargeback or repayment of commissions as a result of policy lapse, surrender, cancellation,
rescission, default, or upon other specified circumstances. As a result of the chargeback or repayment of commissions, we
may incur a reduction in revenue in a particular period related to revenue previously recognized in a prior period and
reflected in our financial statements. Such a reduction could have a material adverse effect on our results of operations and
financial condition, particularly if the reduction in revenue is greater than the amount of related revenue retained by us.
The commission rates are set by insurance carriers and are based on the premiums that the insurers charge. The
potential for changes in premium rates is significant, due to competition and pricing cyclicality in the insurance market. In
addition, the insurance industry has been characterized by periods of intense price competition due to excessive
underwriting capacity and periods of favorable premium levels due to shortages of capacity. Capacity could also be
reduced by insurers failing or withdrawing from writing certain coverages that we offer our clients. Commission rates and
premiums can change based on prevailing legislative, economic, and competitive factors that affect insurance carriers and
brokers. These factors, which are not within our control, include the capacity of insurance carriers to place new business,
competition from other brokers or distribution channels, underwriting and non-underwriting profits of insurance carriers,
consumer demand for insurance products, the availability of comparable products from other insurance carriers at a lower
cost and the availability of alternative insurance products, such as government benefits and self-insurance products, to
consumers. We cannot predict the timing or extent of future changes in commission rates or premiums or the effect any of
these changes will have on our business, financial condition, and results of operations.
If the contracts that govern our MGAs or MGUs are terminated or changed, our business and operating results could be
harmed.
In our Underwriting Management Specialty, we act as an MGA or an MGU for insurance carriers that have
given us authority to underwrite and bind coverage on their behalf. Our Underwriting Management Specialty generated
34.2% and 26.3% of our consolidated total net commissions and fees for the years ended December 31, 2025 and 2024,
respectively. Our MGAs and MGUs are governed by contracts between us and the insurance carriers. These contracts
establish, among other things, the underwriting and pricing guidelines for the programs, the scope of our authority, and our
commission rates for policies that we underwrite under the programs. Some of these contracts can be terminated by the
insurance carrier with minimal advance notice. Moreover, upon expiration of the contract term, insurance carriers may
request changes in the terms of the programs, including the commissions we receive, which could reduce our revenues
from the programs. The termination of any of the contracts that govern our MGAs or MGUs, or a change in the terms of
any of these programs, could harm our business and operating results. We cannot be assured that lost insurance capacity
can be replaced or that the contracts that govern our MGAs or MGUs will not be terminated or modified in the future.
Moreover, we cannot be assured that we will be able to replace any of the capacity of our MGAs or MGUs that are
terminated with a similar program with other insurance carriers.
Supplemental and contingent commissions we receive from insurance carriers are less predictable than standard
commissions, and any decrease in the amount of these kinds of commissions we receive could adversely affect our
results of operations.
Approximately five percent of our Net commissions and fees consists of supplemental and contingent
commissions we receive from insurance carriers. Supplemental and contingent commissions are paid by insurance carriers
based upon the profitability, volume, and/or growth of the business placed with such companies during the prior year. If,
due to the current economic environment, or for any other reason, we are unable to meet insurance carriers’ profitability,
volume, or growth thresholds, or insurance carriers increase their estimate of loss reserves (over which we have no
25
control), actual supplemental and contingent commissions we receive could be less than anticipated, which could adversely
affect our business, financial condition, and results of operations.
If we are unable to collect our receivables, our results of operations and cash flows could be adversely affected.
Our business depends on our ability to obtain payment from our clients or insurer trading partners of the
amounts they owe us for the work we perform. As of December 31, 2025, our receivables for our commissions and fees
were approximately $489.0 million, or approximately 16.0% of our total annual revenues, and portions of our receivables
are increasingly concentrated in certain businesses and geographies.
Macroeconomic or political conditions could result in financial difficulties for our clients and insurer trading
partners, which could cause clients to delay payments to us, request modifications to their payment arrangements that could
increase our receivables balance or default on their payment obligations to us.
Our current market share may decrease as a result of disintermediation within the insurance industry, including
increased competition from insurance companies, technology companies, and the financial services industry, as well as
the shift away from traditional insurance markets.
The insurance intermediary business is highly competitive and we actively compete with numerous firms for
clients and insurance company trading partners, many of which have relationships with insurance companies or have a
significant presence in niche insurance markets that may give them an advantage over us. Other competitive concerns may
include the quality of our products and services, our pricing and the ability of some of our clients to self-insure, and the
entrance of technology companies into the insurance intermediary business. A number of insurance companies are engaged
in the direct sale of insurance, primarily to individuals, and do not pay commissions to agents or brokers. In addition, the
financial services industry may experience further consolidation, and we therefore may experience increased competition
from insurance companies and the financial services industry, as a growing number of larger financial institutions
increasingly, and aggressively, offer a wider variety of financial services, including insurance intermediary services.
In addition, there has been an increase in alternative insurance markets, such as self-insurance, captives, risk
retention groups, parametric insurance, and non-insurance capital markets. While we collaborate and compete in these
segments on a fee-for-service basis, we cannot be certain that such alternative markets will provide the same level of
insurance coverage or profitability as traditional insurance markets.
We are exposed to risk of impairment of goodwill and intangibles; specifically, our goodwill may become impaired in
the future.
As of December 31, 2025, we had $3.2 billion of goodwill recorded on our Consolidated Balance Sheets. We
perform a goodwill impairment test on an annual basis and whenever events or changes in circumstances indicate that the
carrying value of our goodwill may not be recoverable from estimated future cash flows. We review goodwill for
impairment at the reporting unit level, which coincides with the operating business. The determinations of impairment
indicators and the fair value are based on estimates and assumptions related to the amount and timing of future cash flows
and future interest rates. Such estimates and assumptions could change in the future as more information becomes
available, which could impact the amounts reported and disclosed. We completed our most recent evaluation of impairment
for goodwill as of October 1, 2025, and determined that the fair value of goodwill is not less than its carrying value. We
also consider qualitative and quantitative developments between the date of the goodwill impairment review, October 1,
and December 31 to determine if an impairment may be present. No impairments were recorded for the years ended
December 31, 2025 or 2024. A significant and sustained decline in our stock price and market capitalization, a significant
decline in our expected future cash flows, a significant adverse change in the business climate, or slower growth rates could
result in the need to perform an additional impairment analysis prior to the next annual goodwill impairment test. If we
were to conclude that a future impairment of our goodwill is necessary, we would then record the appropriate charge,
which could result in material charges that are adverse to our operating results and financial position. For additional
discussion, see “Note 2, Summary of Significant Accounting Policies” and “Note 6, Goodwill and Other Intangible Assets”
in the footnotes to the consolidated financial statements in this Annual Report.
As of December 31, 2025, we had $1,616.5 million of amortizable intangible assets, primarily consisting of
customer relationship intangibles acquired in connection with our acquisition of US Assure Insurance Services of Florida,
Inc. and various other acquisitions. The carrying value of these intangible assets is periodically reviewed by management to
determine if there are events or changes in circumstances that would indicate that the carrying amount may not be
recoverable. Accordingly, if there are any such circumstances that occur during the year, we assess the carrying value of
our amortizable intangible assets by considering the estimated future undiscounted cash flows generated by the
26
corresponding business or asset group. Any impairment identified through this assessment may require that the carrying
value of related amortizable intangible assets be adjusted; however, no impairments were recorded for the years ended
December 31, 2025 or 2024.
We may use artificial intelligence in our business, and challenges with properly adopting and managing its use could
result in reputational harm, competitive harm, legal liability, and could adversely affect our results of operations.
We have begun to incorporate and intend to expand our use of artificial intelligence (“AI”) solutions into our
platform, offerings, services, and features, and these AI applications may become important in our operations over time.
For example, we are currently using generative AI to automate certain aspects of insurance submission intake and analysis
for our underwriters. Our competitors or other third parties may incorporate AI into their products and services more
quickly or more successfully than us, which could impair our ability to compete effectively and adversely affect our results
of operations.
Additionally, if the content, analyses, or recommendations that AI applications assist in producing are, or are
alleged to be, deficient, inaccurate, or biased, our business, financial condition, and results of operations may be adversely
affected and we may be subject to legal liability claims. The development of AI applications will require additional
investment in the development of proprietary systems, models, or datasets, which are complex, costly, and could impact the
results of our operations. In addition, there is no guarantee that we will be able to develop such applications and execute on
the longer-term aspects of our business strategy.
AI also presents emerging ethical issues and if our use of AI becomes controversial, we may experience brand
or reputational harm, competitive harm, or legal liability. The rapid evolution of AI, including potential government
regulation of AI, will require significant resources to develop, test, and maintain our platform, offerings, services, and
features to help us implement AI ethically in order to minimize unintended, harmful impacts.
We have experienced strong growth in recent years, and our recent growth rates may not be indicative of our future
growth. As our costs increase, we may not be able to generate sufficient revenue to achieve and, if achieved, maintain
profitability.
We have experienced strong revenue growth in recent years. In future periods, we may not be able to sustain
revenue growth consistent with recent history, or at all. We believe our revenue growth depends on a number of factors,
including, but not limited to, market factors (such as flow of business into the E&S market and insurance rates) and our
ability to:
•price our products effectively so that we are able to attract and retain clients without compromising our
profitability;
•attract new clients, successfully deploy and implement our products, obtain client renewals, and provide our
clients with excellent client support;
•attract and retain talented Producers, managers, executives, and other employees;
•increase our network of insurer trading partners;
•adequately expand, train, integrate and retain our wholesale brokers and underwriters and other new
employees, and maintain or increase our sales force’s productivity;
•enhance our information, training, and communication systems to ensure that our employees are well
coordinated and can effectively communicate with each other and clients;
•effectively integrate AI into our workstreams and operations to enhance our productivity and training;
•improve our internal control over financial reporting and disclosure controls and procedures to ensure
timely and accurate reporting of our operational and financial results;
•successfully create new distribution channels;
•successfully introduce new products and enhance existing products;
•successfully introduce our products to new markets inside and outside of the United States;
•successfully compete against larger companies and new market entrants; and
•increase awareness of our brand.
27
We may not successfully accomplish any of these objectives and as a result, it is difficult for us to forecast our
future results of operations. Our historical growth rate should not be considered indicative of our future performance and
may decline in the future. In future periods, our revenue could grow more slowly than in recent years or decline for any
number of reasons, including those outlined above. We also expect our operating expenses to increase in future periods,
particularly as we continue to operate as a public company, continue to invest in talent and technology infrastructure, and
expand our operations internationally. If our revenue growth does not increase to offset these anticipated increases in our
operating expenses, our business, financial position, and results of operations will be harmed, and we may not be able to
achieve or maintain profitability. Furthermore, the additional expenses we will incur may not lead to sufficient additional
revenue to maintain historical revenue growth rates and profitability.
As we expand our business, it is important that we continue to maintain a high level of client service and
satisfaction. If we are not able to continue to provide high levels of client service, our reputation, as well as our business,
results of operations, and financial condition, could be adversely affected.
We may lose clients or business as a result of consolidation within, or the expansion of specialty services provided by,
the retail insurance brokerage industry.
We derive a substantial portion of our business from our relationships with retail insurance brokerage firms.
There has been considerable consolidation in the retail insurance brokerage industry, driven primarily by the acquisition of
small- and mid-size retail insurance brokerage firms by larger brokerage firms, financial institutions, or other organizations.
We expect this trend to continue. As a result, we may lose all or a substantial portion of the business we obtain from retail
insurance brokerage firms that are acquired by other firms who have their own wholesale insurance brokerage operations or
established relationships with other wholesale insurance brokerage firms. In addition, retail insurance brokerages may
decide to create or expand their ability to provide specialty services. To date, our business has not been materially affected
by consolidation among retail insurance brokers or by the specialty services currently provided directly by certain of the
retail brokers with which we do business. However, we cannot be assured that we will not be affected by industry
consolidation or specialty expansion at the retail level that occurs in the future, particularly if any of our significant retail
insurance brokerage clients are acquired by retail insurance brokers with their own wholesale insurance brokerage
operations or preferred relationships with wholesalers other than Ryan Specialty.
Our inability to achieve the intended results of our restructuring program, Empower, could impact our businesses,
financial condition, and results of operations.
As part of our corporate restructuring plans, we expect to incur one-time write-offs and other restructuring
charges and generate annual benefits in the future. There can be no assurance that any restructuring activities that we
undertake will achieve the cost savings, operating efficiencies, or other expected benefits. Our ability to successfully
manage and execute the Empower program and realize the expected savings and benefits in the amounts and at the times
anticipated is important to our business success. Failure to achieve the goals of our plans, which could result from our
inability to successfully execute organizational change and business transformation plans, changes in global or regional
economic conditions, changes in the insurance markets in which we compete, unanticipated costs or charges, and loss of
key or other personnel, could have a material adverse effect on our businesses, financial condition, and results of
operations. Internal restructurings come with an inherent amount of transition risk and can require a significant amount of
time and focus from management and other employees, which may divert attention from our normal operations and could
have a material adverse effect on our business, results of operations and financial condition.
Our growth strategy may involve opening new offices, entering new product lines or establishing new distribution
channels, and will involve hiring new brokers and underwriters, which will require substantial investment by us and
may adversely affect our results of operations and cash flows in a particular period.
Our ability to grow organically depends in part on our ability to open new offices, enter new product lines,
establish new distribution channels, and recruit new wholesale brokers and underwriters. We can provide no assurances
that we will be successful in any efforts to open new offices, develop de novo product lines, establish new distribution
channels, or hire new wholesale brokers or underwriters. The costs of opening a new office, entering a new product line,
establishing a new distribution channel, and hiring the necessary personnel to staff the office can be substantial, and we
often are required to commit to multi-year, non-cancellable lease agreements. The cost of investing in new offices, brokers,
and underwriters may affect our results of operations and cash flows in a particular period. Moreover, we cannot assure you
that we will be able to recover our investment in new offices, brokers, or underwriters or that these offices, brokers, and
underwriters will achieve profitability.
28
We rely on data from our clients and third parties for pricing and underwriting insurance policies, the unavailability or
inaccuracy of which could limit the functionality of our products and disrupt our business.
We use data, technology, and intellectual property licensed from unaffiliated third parties in certain of our
products, including insurance industry proprietary information that we license from third parties, and we may license
additional third-party technology and intellectual property in the future. Any errors or defects in this third-party technology
and intellectual property could result in errors that could harm our brand and business. In addition, licensed technology and
intellectual property may not continue to be available on commercially reasonable terms, or at all. Also, should any third-
party refuse to license its proprietary information to us on the same terms that it offers to our competitors, we could be
placed at a significant competitive disadvantage.
Further, although we believe that there are currently adequate replacements for the third-party technology and
intellectual property we presently use, the loss of our right to use any of this technology and intellectual property could
result in delays in producing or delivering affected products until equivalent technology or intellectual property is
identified, licensed or otherwise procured, and integrated. Our business would be disrupted if any technology and
intellectual property we license from others or functional equivalents of this software were either no longer available to us
or no longer offered to us on commercially reasonable terms. In either case, we would be required either to attempt to
redesign our products to function with technology and intellectual property available from other parties or to develop these
components ourselves, which would result in increased costs and could result in delays in product sales and the release of
new product offerings. Alternatively, we might be forced to limit the features available in affected products. Any of these
results could harm our business, results of operations, and financial condition.
The reinsurance industry is highly competitive and cyclical and certain subsidiaries and entities in which we have
invested may not be able to compete effectively in the future.
The reinsurance industry is highly competitive and has historically been cyclical. Through our indirect
investment in Geneva Re, Ltd. (“Geneva Re”), we compete with numerous reinsurance companies throughout the world.
Many of these competitors may have greater financial, marketing, and management resources available to them, including
greater revenue and scale, have established long-term and continuing business relationships throughout the reinsurance
industry and may have higher financial strength ratings, which can be a significant competitive advantage for them.
Soft market conditions could lead to a significant reduction in reinsurance premium rates and less favorable
contract terms which could negatively affect the return on our investment in Geneva Re and the commissions earned by
Ryan Re. The supply of reinsurance is also related to the level of reinsured losses and the level of industry capital which, in
turn, may fluctuate in response to changes in rates of return earned in the reinsurance industry. As a result, the reinsurance
business historically has been a cyclical industry characterized by periods of intense price competition due to excess
underwriting capacity, as well as periods when shortages of capacity permitted improvements in reinsurance rate levels and
terms and conditions.
The low interest rate environment observed in previous years and ease of entry into the reinsurance sector has
led to increased competition from non-traditional sources of capital, such as insurance-linked funds or collateralized special
purpose insurers, predominantly in the property catastrophe excess reinsurance market. This alternative capital provides
collateralized property catastrophe protection in the form of catastrophe bonds, parametric reinsurance, industry loss
warranties and other risk-linked products that facilitate the ability of non-reinsurance entities, such as hedge funds and
pension funds, to compete for property catastrophe excess reinsurance business outside of the traditional treaty market.
This alternative capacity is also expanding into lines of business other than property catastrophe reinsurance.
The occurrence of natural or man-made disasters could result in declines in business and increases in claims that could
adversely affect our financial condition, results of operations, and cash flows.
We are exposed to various risks arising out of natural disasters, including earthquakes, hurricanes, fires, floods,
landslides, tornadoes, typhoons, tsunamis, hailstorms, climate related events or weather patterns, and pandemic health
events, as well as man-made disasters, including acts of terrorism, military actions, cyberterrorism, explosions, and
biological, chemical, or radiological events. The continued threat of terrorism and ongoing military actions may cause
significant volatility in global financial markets, and a natural or man-made disaster could trigger an economic downturn in
the areas directly or indirectly affected by the disaster. These consequences could, among other things, result in a decline in
business and increased claims from those areas. They could also result in reduced underwriting capacity of our insurance
carriers, making it more difficult for our agents to place business. Disasters also could disrupt public and private
infrastructure, including communications and financial services, which could disrupt our normal business operations. Any
increases in loss ratios due to natural or man-made disasters could impact our supplemental or contingent commissions,
29
which are primarily driven by growth and profitability metrics. A natural or man-made disaster also could disrupt the
operations of our counterparties or result in increased prices for the products and services they provide to us. Finally, a
natural or man-made disaster could increase the incidence or severity of E&O claims against us.
Pandemics or other outbreaks of contagious diseases and measures undertaken to mitigate their spread could materially
adversely affect our business, financial condition, and results of operations and those of our customers, suppliers, and
other trading partners.
The global outbreak of the COVID-19 pandemic and measures to mitigate the spread of COVID-19 caused
unprecedented disruptions to the global and U.S. economies and significantly impacted the global supply chain. Future
pandemics and other outbreaks of contagious diseases could result in similar or worse impacts and significant business and
operational disruptions, including business closures, supply chain disruptions, travel restrictions, stay-at-home orders, and
limitations on the availability of workforces. If significant portions of our workforce are unable to work effectively,
including because of illness or quarantines or from the impacts of any potential future pandemics and other outbreaks of
contagious diseases, our business could be materially adversely affected. It is possible that future pandemics and other
outbreaks of contagious diseases could cause disruption in our customers’ businesses and cause delay or limit the ability of
our customers to perform, including in making timely payments. Future pandemics and other outbreaks of contagious
diseases could impact capital markets, which may impact our, and our customers’, financial position. Future pandemics and
other outbreaks of contagious diseases may also have the effect of exacerbating several of the other risks we face as
discussed in this Annual Report on Form 10-K.
The economic and political conditions of the countries and regions in which we operate could have an adverse impact
on our business, financial condition, operating results, liquidity, and prospects for growth.
Our operations in countries undergoing political change or experiencing economic instability are subject to
uncertainty and risks that could materially adversely affect our business. These risks include the possibility we would be
subject to unstable governments and economies and potential governmental actions affecting the flow of goods, services,
and currency.
We could incur substantial losses from our cash and investment accounts if one of the financial institutions that we use
fails or is taken over by the U.S. Federal Deposit Insurance Corporation (“FDIC”).
We maintain cash and investment balances, including funds held in a fiduciary capacity, held in premium trust
accounts, at numerous depository institutions in amounts that are significantly in excess of the limits insured by the FDIC.
If one or more of the depository institutions with which we maintain significant cash balances were to fail or be taken over
by the FDIC, our ability to access these funds might be temporarily or permanently limited, and we could face material
liquidity problems and potential material financial losses.
Our offices are geographically dispersed across the United States, the United Kingdom, Europe, Canada, India,
Australia, the United Arab Emirates, and Singapore, and we may not be able to respond quickly to operational or
financial problems or promote the desired level of cooperation and interaction among our offices, which could harm
our business and operating results.
As of December 31, 2025, we had 129 offices across the United States, the United Kingdom, Europe, Canada,
Australia, the United Arab Emirates, India, and Singapore. Some of these offices are under the day-to-day management of
individuals who previously owned an acquired business or played a key role in the development of an office. These
individuals may not report negative developments that occur in their businesses to management on a timely basis because
of, among other things, the potential damage to their reputation, the risk that they may lose all or some of their operational
control, the risk that it could impair financial earnouts or incentive compensation, or the risk that they may be personally
liable to us under the indemnification provisions of the agreements pursuant to which their businesses were acquired.
Moreover, there can be no assurances that management will be able to independently detect adverse developments that
occur in particular offices. We review the performance of our offices on a monthly basis, maintain frequent contact with all
of our offices and work with our offices on an annual basis to prepare a detailed operating budget for revenue production
by office. Although we believe that these and other measures have allowed us generally to detect and address known
operational issues that might have a material effect on our operating results, they may not detect all issues in time to permit
us to take appropriate corrective action. Our business and operating results may be harmed if our management does not
become aware, on a timely basis, of negative business developments, such as the possible loss of an important client,
threatened litigation or regulatory action, or other developments.
30
In addition, our ability to grow organically will require the cooperation of the individuals who manage our
offices. We cannot provide assurance that these individuals will cooperate with our efforts to improve the operating results
in offices for which they are not directly responsible. Our dispersed operations may impede our integration efforts and
organic growth, which could harm our business and operating results.
Our non-U.S. operations expose us to exchange rate fluctuations and various risks that could impact our business.
Approximately 6% and 5% of our revenues for the years ended December 31, 2025 and 2024, respectively,
were generated outside of the United States. We are exposed to currency risk from the potential changes between the
exchange rates of the US Dollar, British Pound, Euro, Swedish Krona, Canadian Dollar, Indian Rupee, Singapore Dollar,
and other currencies. Exchange rate movements may change over time, and could have an adverse impact on our financial
results and cash flows reported in U.S. dollars. Our U.S. operations earn revenue and incur expenses primarily in U.S.
dollars. Due to fluctuations in foreign exchange rates, we are subject to economic exposure, as well as currency translation
exposure on the net operating results of our operations. Because our non-U.S. based revenue is exposed to foreign
exchange fluctuations, exchange rate movement can have an impact on our business, financial condition, results of
operations, and cash flow. For additional discussion, see “Quantitative and Qualitative Disclosures about Market Risk”
included elsewhere in this Annual Report.
Scrutiny and changing expectations from the federal and state governments, governmental organizations, investors,
clients, and our employees with respect to our corporate responsibility and stakeholder interest practices may impose
additional costs on us or expose us to new or additional risks.
There is ongoing focus, including from the federal and state governments, governmental organizations,
investors, employees, and clients, on corporate responsibility and stakeholder interest issues such as environmental
stewardship, climate change, diversity and workplace inclusion, pay equity, racial justice, workplace conduct,
cybersecurity, and data privacy. There are divergent views on these topics which increase the risk that any action or lack
thereof with respect to our perceived corporate responsibility and stakeholder interest practices will be viewed negatively.
In March 2025, the federal government issued an executive order titled “Ending Illegal Discrimination and
Restoring Merit-Based Opportunity,” rescinding prior directives that promoted diversity, equity, and inclusion (“DEI”)
initiatives. This order signals a shift in regulatory priorities, directing agencies to evaluate DEI practices for consistency
with federal nondiscrimination laws. The evolving regulatory environment could materially affect us, though the scope and
approach to enforcement remains uncertain.
There can be no certainty that we will manage such issues successfully, or that we will successfully meet
governmental or societal expectations as to the proper approach to corporate responsibility. Negative public perception,
adverse publicity, or negative comments in social media, including as a result of actions taken by companies we acquire
before the acquisition, could damage our reputation or harm our relationships with regulators and the communities in
which we operate if we do not, or are not perceived to, adequately address these issues. Any harm to our reputation could
impact employee engagement and retention and the willingness of our trading partners to do business with us. If we do not
successfully manage expectations across these varied interests, it could erode trust, generate litigation, and impact our
reputation, which could result in harm to our business, results of operations, and financial condition.
In addition, a variety of organizations have developed ratings to measure the performance of companies on
topics of corporate responsibility or stakeholder interests, and the results of these assessments are widely publicized.
Investments in funds that specialize in companies that perform well in such assessments remain popular, and major
institutional investors have publicly emphasized the importance of such measures to their investment decisions.
Unfavorable ratings of our Company or our industry, as well as omission of inclusion of our stock into investment funds
oriented toward various corporate responsibility and stakeholder interests may lead to negative investor sentiment and the
diversion of investment to other companies or industries, which could have a negative impact on our stock price.
Risks Related to Intellectual Property, Data Privacy, and Cybersecurity
We rely on the efficient, uninterrupted, and secure operation of complex information technology systems and networks
to operate our business. Any significant system or network disruption due to a breach in the security of our information
technology systems could have a negative impact on our reputation, regulatory compliance status, operations, sales, and
operating results.
While we manage some of our information technology systems and some are outsourced to third parties, all
information technology systems are potentially vulnerable to damage, breakdown, or interruption from a variety of sources,
31
including but not limited to cyberattacks, ransomware, malware, security breaches, theft or misuse, unauthorized access or
improper actions by insiders or employees, sophisticated nation-state and nation-state-supported actors, natural disasters,
terrorism, war, telecommunication, and electrical failures or other compromise. We are at risk of attack by a growing list of
adversaries through increasingly sophisticated methods. Because the techniques used to infiltrate or sabotage systems
change frequently, we may be unable to anticipate these techniques or implement adequate preventative measures.
We have experienced, and may in the future experience, whether directly or indirectly through third parties,
cybersecurity incidents. We have been, and expect to continue to be, the target of fraudulent calls, emails, and other forms
of fraudulent activities and have experienced security breaches. However, to date, such security breaches have not had a
material impact on our business strategy, results of operations, or financial condition. The use of AI applications may result
in cybersecurity incidents that implicate the personal data of end users of such applications. Furthermore, any confidential
information, including sensitive information, that is disclosed to a third-party generative AI platform could be leaked or
disclosed to others. Any such cybersecurity incidents could adversely affect our reputation and results of operations.
If we fail to make requisite notifications within the timelines required under applicable laws it could result in
violations, fines, penalties, litigation, proceedings, or enforcement action. In addition, it is possible that state regulators
may initiate investigations of the Company in connection with a breach, that the Company could be subject to civil
penalties, resolution agreements, monitoring or similar agreements, or third-party claims against the Company, including
class-action lawsuits. Moreover, incidents could occur with respect to our systems or the systems of our third-party service
providers, as well as any other data breaches or other misuse or disclosure of our participant or other data, could lead to
improper use or disclosure of Company information, including personally identifiable information or protected health
information obtained from our participants, and information from employees. Any such breach or misuse of data could
harm our reputation, lead to legal exposure, divert management attention and resources, increase our operating expenses
due to the employment of consultants and third-party experts and the purchase of additional security infrastructure, and/or
subject us to liability, resulting in increased costs and loss of revenue. In addition, any remediation efforts we undertake
may not be successful. The perception that we do not adequately protect the privacy of information of our employees or
clients could inhibit our growth and damage our reputation.
If we are unable to maintain and upgrade our system safeguards, we may incur unexpected costs and certain
aspects of our systems may become more vulnerable to unauthorized access. While we select our clients and third-party
vendors carefully, cyberattacks and security breaches at a client or vendor could adversely affect our ability to deliver
products and services to its customers and otherwise conduct its business and could put our systems at risk. Additionally,
we are an acquisitive organization and the process of integrating the information systems of the businesses we acquire is
complex and exposes us to additional risk as we might not adequately identify weaknesses in an acquisition targets’
information systems, which has in the past and could in the future expose us to costs and/or unexpected liabilities or make
our own systems more vulnerable to attack. Additionally, our public announcement of the signing or closing of an
acquisition could increase the possibility of threat actors targeting the companies that we will or have acquired. These types
of breaches affecting us, our clients, or our third-party vendors could result in intellectual property or other confidential
information being lost or stolen, including client, employee, or company data. In addition, we may not be able to detect
breaches in our information technology systems or assess the severity or impact of a breach in a timely manner.
We have implemented various measures to manage our risks related to system and network security and
disruptions, but a security breach or a significant and extended disruption in the functioning of our information technology
systems could damage our reputation and cause us to lose clients, adversely impact our operations and operating results,
and require us to incur significant expense to address and remediate or otherwise resolve such issues. In order to maintain
the level of security, service, compliance, and reliability that our clients and laws of various jurisdictions require, we will
be required to make significant additional investments in our information technology systems on an ongoing basis.
Improper disclosure of confidential, personal, or proprietary data, whether due to human error, misuse of information
by employees or counterparties, or as a result of cyberattacks, could result in regulatory scrutiny, legal liability or
reputation damage, which in turn could have an adverse effect on our reputation, regulatory compliance status,
operations, sales, and operating results.
We maintain confidential, personal, and proprietary information relating to our Company, our employees, and
our clients. This information includes personally identifiable information, protected health information, and financial
information. We are subject to data privacy laws and regulations relating to the collection, use, retention, security, and
transfer of this information. The inability to adhere to or to successfully implement processes and controls in response to
these laws, rules, and regulations could impair our reputation, restrict our ability to operate in certain jurisdictions, or result
32
in additional legal liability, which in turn could adversely impact our reputation, regulatory compliance status, operations,
and operating results.
Our business performance and growth plans could be negatively affected if we are not able to gain internal efficiencies
through the application of technology or effectively apply technology in facilitating operations and driving value for our
clients through innovation and technology-based solutions. Conversely, investments in internal systems or innovative
product offerings may fail to yield sufficient return to cover their investments and the attention of the management team
could be diverted.
Our success depends, in part, on our ability to develop and implement technology-based solutions, including AI
applications, that anticipate or keep pace with rapid and continuing changes in technology, operational needs, industry
standards, and client preferences. We may not be successful in anticipating or responding to these developments on a
timely and cost-effective basis. The effort to gain technological expertise, develop new technologies in our business, keep
pace with insurtech, and achieve internal efficiencies through technology require us to incur significant expenses and
attract talent with the necessary skills. There is no assurance that our technological investments in internal systems and
digital distribution platforms will achieve the intended efficiencies, and such unrealized savings or benefits could affect our
results of operations. There is no assurance that our technological investments will properly facilitate our operational needs,
and any failure of technology and automated systems to function or perform as expected could harm our operations,
business, and financial condition. Additionally, if we cannot offer new technologies as quickly as our competitors, if our
competitors develop more cost-effective technologies, or if our ideas are not accepted in the marketplace, it could have a
material adverse effect on our ability to obtain and complete client engagements. Innovations in software, cloud computing,
or other technologies that alter how our services are delivered could significantly undermine our investment decisions if we
are slow to innovate or unable to take advantage of these developments.
We are continually developing and investing in innovative and novel service offerings that we believe will
address needs that we identify in the markets. Nevertheless, for those efforts to produce meaningful value, we are reliant on
a number of other factors, some of which are outside of our control. For example, starting a de novo MGU or insurance
program takes a certain amount of investment before we are able to secure insurance carriers to support the underwriting,
which is a precursor to entering the marketplace. Even after securing insurance carriers, we may not be able to compete
effectively with other products in the marketplace on pricing, terms, and conditions in order to be successful. The
development and implementation of these offerings also may divert the attention of our management team.
Infringement, misappropriation, or dilution of our intellectual property could harm our business.
We believe our trademarks have significant value and that these and other intellectual property are valuable
assets that are critical to our success. Unauthorized uses or other infringement of our trademarks or service marks could
diminish the value of our brand and may adversely affect our business. Effective intellectual property protection may not
be available in every market. Failure to adequately protect our intellectual property rights could damage our brand and
impair our ability to compete effectively. Some of our brand names are not registered, and we rely on common-law
trademark protection to protect this intellectual property. Even where we have effectively secured statutory protection for
our trademarks and other intellectual property, our competitors and other third parties may misappropriate our intellectual
property, and in the course of litigation, such competitors and other third parties might attempt to challenge the breadth of
our ability to prevent others from using similar marks or designs. If such challenges were to be successful, less ability to
prevent others from using similar marks or designs may ultimately result in a reduced distinctiveness of our brand in the
minds of consumers. Defending or enforcing our trademark rights, branding practices, and other intellectual property could
result in the expenditure of significant resources and divert the attention of management, which in turn may materially and
adversely affect our business and operating results, even if such defense or enforcement is ultimately successful. Even
though competitors occasionally may attempt to challenge our ability to prevent infringers from using our marks, we are
not aware of any challenges to our right to use any of our brand names or trademarks.
Failure to protect our intellectual property rights, or allegations that we have infringed on the intellectual property
rights of others, could harm our reputation, ability to compete effectively, and financial condition.
To protect our intellectual property rights, we rely on a combination of trademark laws, copyright laws, trade
secret protection, confidentiality agreements, and other contractual arrangements with our affiliates, employees, clients,
strategic partners, and others, as well as internal policies and procedures regarding our management of intellectual
property. However, the protective steps that we take may be inadequate to deter misappropriation of our proprietary
information. In addition, we may be unable to detect the unauthorized use of, or take appropriate steps to enforce, our
intellectual property rights. Further, we operate in many foreign jurisdictions and effective trademark, copyright, and trade
33
secret protection may not be available in every country or jurisdiction in which we offer our services. Additionally, our
competitors may develop products similar to our products that do not conflict with our related intellectual property rights.
Failure to protect our intellectual property adequately could harm our reputation and affect our ability to compete
effectively.
In addition, to protect or enforce our intellectual property rights, we may initiate litigation against third parties,
such as infringement suits or interference proceedings. Third parties may assert intellectual property rights claims against
us, which may be costly to defend, could require the payment of damages, and could limit our ability to use or offer certain
technologies, products, or other intellectual property. Any intellectual property claims, with or without merit, could be
expensive, take significant time, and divert management’s attention from other business concerns. Successful challenges
against us could require us to modify or discontinue our use of technology or business processes where such use is found to
infringe or violate the rights of others, or require us to purchase licenses from third parties, any of which could adversely
affect our business, financial condition, and operating results.
Risks Related to Legal and Regulatory Issues
Our businesses are subject to governmental regulation, which could reduce our profitability, limit our growth, or
increase competition.
Our businesses are subject to legal and regulatory oversight throughout the world, including by U.S. state
regulators and under the U.K. Companies Act and the rules and regulations promulgated by the Financial Conduct
Authority (“FCA”), the Foreign Corrupt Practices Act, the Bribery Act of 2010 in the U.K., the U.K. Economic Crime and
Corporate Transparency Act 2023, and a variety of other laws, rules, and regulations addressing, among other things,
licensing, data privacy and protection, anti-money laundering, sanctions, wage and hour standards, employment and labor
relations, anti-competition, fraud prevention, and anti-corruption. This legal and regulatory oversight could reduce our
profitability or limit our growth by: increasing the costs of legal and regulatory compliance; limiting or restricting the
products or services we sell, the markets we serve or enter, the methods by which we sell our products and services, the
prices we can charge for our services, or the form of compensation we can accept from our clients, insurance carriers, and
third parties; or by subjecting our businesses to the possibility of legal and regulatory actions or proceedings.
We are experiencing and reacting to substantial geopolitical and regulatory changes on a real-time basis, and the
extent of such changes is not currently known. Changes in the regulatory scheme, or even changes in how existing
regulations are interpreted, could have an adverse impact on our results of operations by limiting revenue streams or
increasing costs of compliance. For instance, the European Union’s General Data Protection Regulation (the “EU GDPR”)
imposes a range of compliance obligations and increased financial penalties for noncompliance. Accordingly, we may
experience significant fines and penalties if we fail to comply with the EU GDPR. Following the implementation of the EU
GDPR, other jurisdictions have sought to amend, or propose legislation to amend, their existing data protection laws to
align with the requirements of the EU GDPR with the aim of obtaining an adequate level of data protection to facilitate the
transfer of personal data to most jurisdictions from the EU. Additionally, some countries have also proposed sweeping new
data protection laws. For example, Canada is proposing significant changes to its federal privacy law. Accordingly, the
challenges we face in the EU also apply to other jurisdictions that adopt laws similar to the EU GDPR or regulatory
frameworks of equivalent complexity. On November 19, 2025, the EU Commission released a Digital Omnibus Package
which is intended to amend the EU GDPR and other EU legislation. If the proposals are adopted, the rules concerning
topics such as data breach notification and online cookie tracking will be amended. Compliance and operational costs
associated with the implementation of any changes to the existing EU data protection regime may be significant.
The U.K. has implemented legislation focusing on data protection and privacy, including the U.K. GDPR and
Data Protection Act 2018, which provides for fines of up to the greater of 17.5 million British Pounds or 4% of a
company’s worldwide annual turnover from the preceding year. On June 28, 2021, the European Commission announced a
decision of adequacy concluding that the U.K. ensures an equivalent level of data protection to the EU GDPR, which
provides some relief regarding the legality of continued personal data flows from the European Economic Area (the
“EEA”) to the U.K. The EU-UK adequacy decision was extended in late 2025 to be effective until December 27, 2031. On
June 19, 2025, the Data Use and Access Act 2025 (“DUAA”) received royal assent and updated existing laws including the
U.K. GDPR, the Data Protection Act 2018, and the Privacy and Electronic Communications Regulations (“PECR”). The
changes in the DUAA are intended to simplify compliance obligations for organizations. The law, however, creates a
divergent approach to the EU GDPR on areas such as automated decision making which might increase compliance and
non-compliance costs. We cannot fully predict how the Data Protection Act and other U.K. data protection laws or
regulations might develop in the medium to longer term, nor the effects of divergent laws and guidance regarding how data
transfers to and from the U.K. will be regulated.
34
In the United States, the California Consumer Privacy Act (the “CCPA”) came into effect in January 2020 and
has been amended several times. The CCPA, as amended by the California Privacy Rights Act, requires increased
transparency and data subject rights such as access and deletion, an ability to opt out of the “sale” or “sharing” of personal
information, and the ability to limit the disclosure of “sensitive” personal information. Following the expiration of the
CCPA’s previous business to business and employment exemptions, personal information relating to employees and
business representatives is now in scope. The CCPA also created the California Privacy Protection Agency, which is
proposing extensive new regulations concerning such matters as risk assessments, cybersecurity audits, and artificial
intelligence. Following the passage of the CCPA, multiple other U.S. states have passed their own privacy laws, although
to date most of these do not apply to the financial services industry. This, along with a growing number of other U.S. states
that are proposing new privacy laws, has created the need for multi-state compliance. We continue to monitor and adapt to
this evolving privacy landscape. There also remains the possibility that a federal privacy law will be implemented. In
addition, the National Association of Insurance Commissioners is working on a revised model privacy law that, if adopted
by the states, would further expand consumer privacy rights and regulatory requirements applicable to the insurance
industry.
In addition to data protection laws, certain countries and U.S. states are enacting cybersecurity laws and
regulations. For example, in 2017 the New York State Department of Financial Services issued cybersecurity regulations
which imposed an array of detailed security measures on covered entities. These regulations have now been amended to
add additional data security requirements on entities licensed to conduct financial services business in New York,
including, among other requirements, independent audits, annual risk assessments, reporting of all ransomware attacks, and
management’s allocation of appropriate resources to cybersecurity programs. Many other states have also adopted laws
covering data collected by insurance licensees that include security and breach notification requirements. The EU has
adopted the Digital Operations Resilience Act (“DORA”), which requires procedures to be in place to assess and oversee
information and communications technology (“ICT”) risk, protect ICT assets, report incidents, and oversee third parties.
The FCA has also recently introduced rules relating to operational resilience. All of these evolving compliance and
operational requirements impose significant costs and other burdens that are likely to increase over time, might divert
resources from other initiatives and projects, and could restrict the way services involving data are offered, all of which
may adversely affect our results of operations. In addition, the risk of noncompliance poses significant regulatory exposure,
including the potential for fines and penalties.
Certain jurisdictions have enacted data localization laws and cross-border personal data transfer laws, which
could make it more difficult to transfer information across jurisdictions (such as transferring or receiving personal data that
originates in the EU). Existing mechanisms that may facilitate cross-border personal data transfers may change or be
invalidated. For example, absent appropriate safeguards or other circumstances, the EU GDPR generally restricts the
transfer of personal data to countries outside of the EEA, such as the United States, which the European Commission does
not consider to provide an adequate level of data privacy and security. On July 10, 2023, the European Commission
adopted its adequacy decision for the EU-US Data Privacy Framework (“EU-US DPF”). The EU-US DPF imposes new
requirements and obligations on private companies and governmental agencies. The EU-US DPF was subject to a legal
challenge in September 2025, which was dismissed by the General Court of the European Union. The dismissal has
subsequently been appealed to the European Court of Justice, which demonstrates that the legal landscape applicable to
data privacy continues to remain in flux. We will need to continue to carefully monitor developments in this area to help
facilitate compliance. The risk of noncompliance poses significant regulatory risk, including the potential for fines and
penalties.
Our acquisitions of new businesses and our continued operational changes and entry into new jurisdictions and
new service offerings increase our legal and regulatory compliance complexity, as well as the type of governmental
oversight to which we may be subject. With our entry into distributing employee benefits insurance products and services,
compliance with the Health Insurance Portability and Accountability Act of 1996 has become a more significant factor for
our business.
Our continuing ability to provide insurance broking and underwriting services in the jurisdictions in which we
operate depends on our compliance with the rules and regulations promulgated from time to time by the regulatory
authorities in each of these jurisdictions. Also, we can be affected indirectly by the governmental regulation and
supervision of insurance companies. For instance, if we are providing our managing general underwriting services for an
insurer, we may have to contend with regulations that the insurer expects us to comply with.
It is expected that the insurance and financial services industries will face greater regulation regarding the use of
AI and automated decision-making that affects individual consumers. For example, the National Association of Insurance
Commissioners has proposed a model bulletin for states to adopt that would guide the insurance industry towards assuring
35
that the use of such technologies does not cause unfair discrimination. This bulletin has been adopted by almost half of the
states in the U.S. Some states have adopted new statutes or issued their own bulletins or circular letters addressing these
risks. In addition, the EU Artificial Intelligence Act (“EU AI Act”) became effective in 2024. The EU AI Act regulates the
placing on the market, putting into service, and use of artificial intelligence systems within the EU. Certain provisions of
the EU AI Act became applicable in February 2025 and other provisions are being phased-in through August 2027. We
will need to continue to carefully monitor developments in this area to help facilitate compliance. The risk of
noncompliance poses significant regulatory exposure, including the potential for fines and penalties.
Our business is subject to risks related to legal proceedings and governmental inquiries.
We are subject to litigation, regulatory, and other governmental investigations and claims arising in the ordinary
course of our business operations. The risks associated with these matters often may be difficult to assess or quantify and
the existence and magnitude of potential claims often remain unknown for substantial periods of time. While we have
insurance coverage for some of these potential claims, others may not be covered by insurance, insurers may dispute
coverage, or any ultimate liabilities may exceed our coverage. We may be subject to actions and claims relating to the sale
of insurance or our other operations, including the suitability of such products and services. Actions and claims may result
in the rescission of such sales; consequently, our trading partners may seek to recoup commissions or other compensation
paid to us, which may lead to legal action against us. The outcome of such actions cannot be predicted and such claims or
actions could have a material adverse effect on our business, financial condition, and results of operations.
We must comply with and are affected by various laws and regulations, as well as regulatory and other
governmental investigations, that impact our operating costs, profit margins, and our internal organization and operation of
our business. The insurance industry, including the premium finance business, has been subject to a significant level of
scrutiny by various regulatory and governmental bodies, including state attorneys general offices and state departments of
insurance, concerning certain practices within the insurance industry. These practices include, without limitation, the
receipt of supplemental and contingent commissions by insurance brokers and agents from insurance companies and the
extent to which such compensation has been disclosed, the collection of broker fees, which we define as fees separate from
commissions charged directly to clients for efforts performed in the issuance of new insurance policies, bid rigging and
related matters. From time to time, our subsidiaries receive informational requests from governmental authorities.
There have been a number of revisions to existing, or proposals to modify or enact new, laws and regulations
regarding insurance agents and brokers. These actions have imposed, or could impose, additional obligations on us with
respect to our products sold. Some insurance companies have agreed with regulatory authorities to end the payment of
supplemental or contingent commissions on insurance products, which could impact our commissions that are based on the
volume, consistency, and profitability of business generated by us.
In the past, state regulators have scrutinized the manner in which insurance brokers are compensated. These
actions have created uncertainty concerning long-standing methods of compensating insurance brokers. Given that the
insurance brokerage industry has faced scrutiny from regulators in the past over its compensation practices, and the
transparency and discourse to clients regarding brokers’ compensation, it is possible that regulators may choose to revisit
the same or other practices in the future. If they do so, compliance with new regulations along with any sanctions that
might be imposed for past practices deemed improper could have an adverse impact on our future results of operations and
inflict significant reputational harm on our business.
We cannot predict the impact that any new laws, rules, or regulations may have on our business, financial
condition, and results of operations. Given the current regulatory environment and the number of our subsidiaries operating
in local markets throughout the country, it is possible that we will become subject to further governmental inquiries and
subpoenas and have lawsuits filed against us. Regulators may raise issues during investigations, examinations, or audits
that could, if determined adversely, have a material impact on us. The interpretations of regulations by regulators may
change and statutes may be enacted with retroactive impact. We could also be materially adversely affected by any new
industry-wide regulations or practices that may result from these proceedings.
Our involvement in any investigations and lawsuits would cause us to incur additional legal and other costs and,
if we were found to have violated any laws, we could be required to pay fines, damages, and other costs, perhaps in
material amounts. Regardless of final costs, these matters could have a material adverse effect on us by exposing us to
negative publicity, reputational damage, harm to client relationships, or diversion of personnel and management resources.
36
We are subject to a number of, or may become subject to, E&O claims, as well as other contingencies and legal
proceedings which, if resolved unfavorably to us, could have an adverse effect on our results of operations.
We assist our clients with various matters, including placing insurance, advocating with respect to claims,
handling related claims, and facilitating premium financing. E&O claims against us may result in potential liability for
damages arising from these services. E&O claims could include, for example, the failure of our employees or sub-agents,
whether negligently or intentionally, to place coverage correctly or notify insurance carriers of claims on behalf of clients,
provide insurance carriers with complete and accurate information relating to the risks being insured, or properly exercise
our delegated authority to underwrite or bind coverage, issue policies or other documents, or provide proper notices to
insureds. In addition, we are subject to other types of claims, litigation, and proceedings in the ordinary course of business,
which along with E&O claimants may seek damages, including punitive damages, in amounts that could, if awarded, have
a material adverse impact on our financial position, results of operations, and cash flows. In addition to potential liability
for monetary damages, such claims or outcomes could harm our reputation or divert management resources away from
operating our business.
We have historically purchased, and continue to purchase, insurance to cover E&O claims to provide protection
against certain losses that arise in such matters. As of December 31, 2025, our E&O insurance policy tower has a $150.0
million limit per occurrence and in the aggregate, and our E&O coverage is subject to a self-insured retention of $5 million
per claim. If we exhaust or materially deplete our coverage under our E&O policy, it could have a significant adverse
financial impact. Accruals for these exposures, when applicable, have been recorded to the extent that losses are deemed
probable and are reasonably estimable. These accruals are adjusted from time to time as developments warrant and may
also be adversely affected by disputes we may have with our insurers over coverage.
Our handling of client funds and surplus lines taxes exposes us to complex fiduciary regulations.
We collect premiums from insureds and, after deducting our commissions and fees, remit the premiums to
insurers or other third-party insurance markets. We also collect funds for claims or refunds from insurers on behalf of
insureds, which are remitted to those insureds. We also collect surplus line taxes for remittance to state taxing authorities.
Consequently, at any given time, we may hold funds of our clients, insurer trading partners, or for taxes, and we are subject
to various laws, regulations, and contractual arrangements governing the holding, management, and investing of these
funds. Any loss, theft, or misappropriation of these funds, caused by employee or third-party fraud, execution of
unauthorized transactions, errors relating to transaction processing, or other events could subject us to claims brought by
insureds, insurers, and insurance intermediaries, as well as to fines, penalties, and reputational risk as a result of an alleged
fiduciary breach and adversely affect our results of operations.
While we are in possession of client, insurer trading partner, and tax funds, we may invest those funds in certain
short-term high-quality securities, such as AAA-rated money market funds as rated by Moody’s. If the institution holding
these funds experiences any illiquidity or insolvency event, we may not be able to access client funds timely, if at all,
which could significantly affect our results of operations and financial condition and expose us to additional legal and
regulatory fines or sanctions. Our handling and investment of client, insurer trading partner, and tax funds held in a
fiduciary capacity is subject to regulatory oversight and contractual agreements and the mishandling of such funds could
subject us to fines and sanctions which could significantly affect our results of operations and financial condition.
Changes in tax laws or regulations that are applied adversely to us or our clients may have a material adverse effect on
our business, cash flow, financial condition, or results of operations.
We are subject to taxation at the federal, state, and local levels in the United States and various other countries
and jurisdictions. Our future effective tax rate and cash flows could be affected by changes in the composition of earnings
in jurisdictions with differing tax rates, changes in statutory rates and other legislative changes, changes in the valuation of
our deferred tax assets and liabilities, changes in determinations regarding the jurisdictions in which we are subject to tax,
and our ability to repatriate earnings from foreign jurisdictions. From time to time, U.S. federal, state, and local and foreign
governments make substantive changes to tax rules and their application, which could result in materially higher corporate
taxes than would be incurred under existing tax law and could adversely affect our financial condition or results of
operations. We are subject to ongoing and periodic tax audits and disputes in U.S. federal and various state, local, and
foreign jurisdictions. An unfavorable outcome from any tax audit could result in higher tax costs, penalties, and interest,
thereby adversely affecting our financial condition or results of operations.
In addition, we are directly and indirectly affected by new tax legislation and regulation and the interpretation
of tax laws and regulations worldwide. Changes in such legislation, regulation, or interpretation could increase our taxes
and have an adverse effect on our operating results and financial condition. This includes potential changes in tax laws or
37
the interpretation of tax laws arising out of the Base Erosion Profit Shifting project (“BEPS”) initiated by the Organization
for Economic Co-operation and Development (“OECD”). In July and October of 2021, the OECD/G-20 Inclusive
Framework on BEPS released statements outlining a political agreement on the general rules to be adopted for taxing the
digital economy, specifically with respect to nexus and profit allocation (Pillar One) and rules for a global minimum tax
(Pillar Two). Further details regarding implementation of these rules are expected to be finalized in the near future. These
rules, should they implemented via domestic legislation of countries or via international treaties, could have a material
impact on our effective tax rate or result in higher cash tax liabilities. There can be no assurance that our tax payments, tax
credits, or incentives will not be adversely affected by these or other initiatives.
Proposed tort reform legislation, if enacted, could decrease demand for casualty insurance, thereby reducing our
commission revenues.
Legislation concerning tort reform has been considered, from time to time, in the United States Congress and in
several state legislatures. Among the provisions considered in such legislation have been limitations on damage awards,
including punitive damages, and various restrictions applicable to class action lawsuits. Enactment of these or similar
provisions by Congress, or by states in which we sell insurance, could reduce the demand for casualty insurance policies or
lead to a decrease in policy limits of such policies sold, thereby reducing our commission revenues.
Regulations affecting insurance carriers with whom we place business affect how we conduct our operations.
Insurers are also regulated by state insurance departments for solvency issues and are subject to reserve
requirements. We cannot guarantee that all insurance carriers with which we do business comply with regulations instituted
by state insurance departments. We may need to expend resources to address questions or concerns regarding our
relationships with these insurers, diverting management resources away from operating our business.
Risks Related to Our Indebtedness
Our substantial indebtedness could adversely affect our financial flexibility and our competitive position and subject us
to contractual restrictions and limitations that could significantly affect our ability to operate.
We have a substantial amount of indebtedness under our Credit Facilities, which requires significant interest
and principal payments. As of December 31, 2025, we had, on a consolidated basis, $3,356 million aggregate principal
amount of outstanding indebtedness, including $400 million related to the 4.375% Senior Secured Notes issued under an
indenture dated February 3, 2022, an aggregate of $1,200 million related to the 5.875% Senior Secured Notes issued under
an indenture dated September 19, 2024, as supplemented on December 9, 2024, and $1,683 million of borrowings under
our Term Loan with JPMorgan Chase Bank, N.A., as administrative agent (the “Administrative Agent”) and $73 million
borrowings under our Revolving Credit Facility. We have commitments available to be borrowed under the Revolving
Credit Facility of $1,327 million, subject to customary conditions, all of which would be secured on a first-priority basis if
borrowed. Our substantial indebtedness could have significant effects on our business and consequences to holders of our
debt. For example, it could:
•make it more difficult for us to satisfy our obligations with respect to our current and future indebtedness,
including the Senior Secured Notes and the indebtedness governed by our Credit Agreement;
•increase our vulnerability to adverse changes in prevailing economic, industry, and competitive conditions,
including recessions and periods of significant inflation, rising interest rate environments, and financial
market volatility;
•require us to dedicate a substantial portion of our cash flow from operations to make payments on our
indebtedness, thereby reducing the availability of our cash flow to fund working capital, capital
expenditures, acquisitions, the execution of our business strategy, and other general corporate purposes;
•limit our flexibility in planning for, or reacting to, changes in our business and the industry in which we
operate;
•increase our cost of borrowing;
•restrict us from capitalizing on business opportunities;
•place us at a disadvantage compared to our competitors that have less indebtedness; and
38
•limit our ability to borrow additional funds for working capital, capital expenditures, acquisitions,
indebtedness service requirements, execution of our business strategy, and other general corporate
purposes.
We expect to use cash flow from operations to meet our current and future financial obligations, including
funding our operations and acquisitions, dividend payments, indebtedness service requirements (including payments on the
Senior Secured Notes), and capital expenditures. A portion of our indebtedness is floating rate. We have experienced
significant interest rate changes, variability, and volatility in the past. Should interest rates increase in the future, we could
incur increased interest expense. The ability to make these payments depends on our financial and operating performance,
which is subject to prevailing economic, industry, and competitive conditions and to certain financial, business, economic,
and other factors beyond our control.
We are required to regularly pay interest on our debt, and to pay down debt principal, and we bear risk
associated with retiring or refinancing principal as our debt matures. Our ability to make interest and principal payments, to
refinance our debt obligations, and to fund acquisitions, internal investments, and capital expenditures is determined by our
ability to generate cash from operations, which in turn is subject to general economic, industry, financial, business,
competitive, legislative, regulatory, and other factors that are beyond our control. Interest and principal obligations reduce
our ability to use that cash for other purposes, including working capital, distributions, acquisitions, capital expenditures,
and general corporate purposes. If we cannot service our debt obligations, we may have to take actions such as selling
assets, raising equity on terms dilutive to existing stockholders, or reducing or delaying acquisitions, capital expenditures,
or investments, any of which could limit our ability to execute our business strategy.
If we cannot make scheduled payments on our indebtedness, we will be in default and holders of the Senior
Secured Notes could declare all outstanding principal and interest to be due and payable, the lenders under the Credit
Agreement governing our Term Loan and Revolving Credit Facility could foreclose against the assets securing their
borrowings, and we could be forced into bankruptcy or liquidation. Additionally, we may need to refinance all or a portion
of our indebtedness before maturity. It cannot be assured that we will be able to refinance any of our indebtedness on
commercially reasonable terms or at all. There can be no assurance that we will be able to obtain sufficient funds to enable
us to repay or refinance our debt obligations on commercially reasonable terms, or at all.
Despite current indebtedness levels, we may incur substantially more indebtedness, which could further exacerbate the
risks associated with our substantial indebtedness.
We may be able to incur significantly more indebtedness in the future, resulting in higher leverage. The
indentures that govern the Senior Secured Notes and the Credit Agreement governing our Term Loan and Revolving Credit
Facility allow us to incur additional indebtedness, including secured debt. Such additional indebtedness may be substantial.
Our ability to recapitalize, incur additional debt and take a number of other actions that are not prohibited by the terms of
the Senior Secured Notes or the Credit Agreement could have the effect of exacerbating the risks associated with our
substantial indebtedness or diminishing our ability to make payments on our debt when due, and may also require us to
dedicate a substantial portion of our cash flow from operations to payments on our other indebtedness, which would reduce
the availability of cash flow to fund our operations, working capital, acquisitions, and capital expenditures.
We may not be able to generate sufficient cash flow to service all of our indebtedness and may be forced to take other
actions to satisfy our obligations under such indebtedness, which may not be successful.
Our ability to make scheduled payments or to refinance outstanding debt obligations depends on our financial
and operating performance, which will be affected by general economic, industry, financial, business, competitive,
legislative, regulatory, and other factors beyond our control. We may not be able to maintain a sufficient level of cash flow
from operating activities to permit us to pay the principal, premium, if any, and interest on our indebtedness. Any failure to
make payments of interest and principal on our outstanding indebtedness on a timely basis would likely result in a
reduction of our credit worthiness, which would also harm our ability to incur additional indebtedness.
If our cash flows and capital resources are insufficient to fund our debt service obligations, we may be forced to
reduce or delay capital expenditures and acquisitions, sell assets, seek additional capital, or seek to restructure or refinance
our indebtedness. Any refinancing of our indebtedness could be at higher interest rates and may require us to comply with
more onerous covenants. Refinancings may not be successful and may not permit us to meet our scheduled debt service
obligations. In the absence of such cash flows and resources, we could face substantial liquidity problems and might be
required to sell material assets or operations to attempt to meet our debt service obligations. If we cannot meet our debt
39
service obligations, the holders of our indebtedness may accelerate such indebtedness and, to the extent such indebtedness
is secured, foreclose on our assets. In such an event, we may not have sufficient assets to repay all of our indebtedness.
Our business, and therefore our results of operations and financial condition, may be adversely affected by further
changes in the U.S.-based credit markets.
Although we are not currently experiencing any limitation of access to our Revolving Credit Facility and are not
aware of any issues impacting the ability or willingness of our lenders under such Revolving Credit Facility to honor their
commitments to extend us credit, the failure of a lender could adversely affect our ability to borrow on that Revolving
Credit Facility, which over time could negatively impact our ability to consummate acquisitions or make other capital
expenditures. Tightening conditions in the credit markets could adversely affect the availability and terms of future
borrowings or renewals or refinancing.
Credit ratings downgrades would increase our financing costs and could subject us to operational risk.
If we need to raise capital in the future (for example, in order to maintain adequate liquidity, fund maturing debt
obligations, or finance acquisitions or other initiatives), credit rating downgrades would increase our financing costs, and
could limit our access to financing sources. We would also face the risk of a credit rating downgrade if we do not retire or
refinance our debt to levels acceptable to the credit rating agencies in a timely manner. Real or anticipated changes in our
credit ratings will generally affect any trading market for, or trading value of, our securities. Such changes could result
from any number of factors, including the modification by a credit rating agency of the criteria or methodology it applies to
particular issuers, a change in the agency’s view of us or our industry, or as a consequence of actions we take to implement
our corporate strategies. A change in our credit rating could also adversely impact our competitive position.
Our failure to raise additional capital or generate cash flows necessary to expand our operations and invest in new
technologies in the future could reduce our ability to compete successfully and harm our competitive position and
results of operations.
We may need to raise additional funds, and we may not be able to obtain additional debt or equity financing on
favorable terms or at all. If we raise additional equity financing, our security holders may experience significant dilution of
their ownership interests. If we raise additional debt financing, we may be required to accept terms that restrict our ability
to incur additional indebtedness, force us to maintain specified liquidity or other ratios, or restrict our ability to pay
dividends or make acquisitions. If we need additional capital and cannot raise it on acceptable terms, or at all, we may not
be able to, among other things:
•develop and enhance our product offerings;
•continue to expand our organization;
•hire, train, and retain employees;
•respond to competitive pressures or unanticipated working capital requirements; or
•pursue acquisition opportunities.
The agreements governing our debt, including the Senior Secured Notes, contain various covenants that impose
restrictions on us that may affect our ability to operate our business and to make payments on the Senior Secured Notes.
The indentures that govern the Senior Secured Notes and the Credit Agreement that governs our Term Loan and
Revolving Credit Agreement impose, and future financing agreements may impose, operating and financial restrictions on
our activities. In particular, the agreements limit or prohibit our ability to, among other things:
•incur additional debt and guarantees;
•pay distributions or dividends and repurchase stock;
•make other restricted payments, including, without limitation, certain restricted investments and certain
repayments of other debt;
•change the composition of our business;
•create liens;
•enter into agreements that restrict dividends from subsidiaries;
40
•issue certain types of equity which have debt-like features;
•engage in transactions with affiliates; and
•enter into mergers, consolidations, or sales of substantially all of our assets.
The Credit Agreement also requires us to comply with a leverage-based financial maintenance covenant
applicable when our borrowings under the Revolving Credit Facility exceed 35% of the corresponding commitments from
lenders. These restrictions on our ability to operate our business could seriously harm our business by, among other things,
limiting our ability to take advantage of financing, merger and acquisition, and other corporate opportunities.
Further, various risks, uncertainties, and events beyond our control could affect our ability to comply with these
covenants. Failure to comply with any of the covenants in our existing or future financing agreements could result in a
default under those agreements and under other agreements containing cross-default or cross-acceleration provisions. Such
a default would permit lenders to accelerate the maturity of the debt under these agreements and to foreclose upon any
collateral securing the debt. Under these circumstances, we might not have sufficient funds or other resources to satisfy all
of our obligations. In addition, the limitations imposed by financing agreements on our ability to incur additional debt and
to take other actions might significantly impair our ability to obtain other financing. We cannot assure you that we will be
granted waivers or amendments to these agreements if for any reason we are unable to comply with these agreements or
that we will be able to refinance our debt on terms acceptable to us or at all. The occurrence of a default that remains
uncured or the inability to secure a necessary consent or waiver could cause our obligations with respect to our debt to be
accelerated and have a material adverse effect on our financial condition and results of operations.
Risks Related to Our Organizational Structure
We are a holding company and our sole material asset is our ownership of LLC Common Units of the LLC, and,
accordingly, we depend on distributions from the LLC to pay our taxes, satisfy our obligations under the Tax Receivable
Agreement, pay our expenses, and declare and pay dividends. The LLC’s ability to make such distributions may be
subject to various limitations and restrictions.
We are a holding company and have no material assets other than our ownership of LLC Common Units of the
LLC. As such, we have no independent means of generating revenue or cash flow, and our ability to pay our taxes, satisfy
our obligations under the Tax Receivable Agreement, pay operating expenses, or declare and pay dividends in the future
depends on the financial results and cash flows of the LLC and its subsidiaries and distributions we receive from the LLC.
There can be no assurance that the LLC and its subsidiaries will generate sufficient cash flow to distribute funds to us in the
future or that applicable state law and contractual restrictions, including negative covenants in debt instruments of the LLC
and its subsidiaries, will permit such distributions.
The LLC is treated as a partnership for U.S. federal income tax purposes and, as such, is not subject to any
entity-level U.S. federal income tax. Instead, for U.S. federal income tax purposes, taxable income of the LLC is allocated
to the LLC Unitholders, including us. Accordingly, we incur income taxes on our distributive share of any net taxable
income of the LLC. Under the terms of the LLC Operating Agreement, the LLC is obligated to make tax distributions to
the LLC Unitholders, including us. In addition to tax and dividend payments, we also incur expenses related to our
operations, including obligations to make payments under the Tax Receivable Agreement. Due to the uncertainty of various
factors, we cannot precisely quantify the likely tax benefits we will realize as a result of the LLC Common Unit exchanges
and the resulting amounts we are likely to pay out to the current or certain former LLC Unitholders, collectively, pursuant
to the Tax Receivable Agreement; however, as of December 31, 2025, the Company has recorded Tax Receivable
Agreement liabilities on the Consolidated Balance Sheets for the amount of $459.0 million associated with the payments to
be made to current and certain former LLC Unitholders subject to the Tax Receivable Agreement. Under the LLC
Operating Agreement, tax distributions shall be made on a pro rata basis among the LLC Unitholders and will be calculated
without regard to any applicable basis adjustment from which we may benefit under Section 743(b) of the U.S. Internal
Revenue Code of 1986, as amended (the “Code”).
We intend to cause the LLC to make cash distributions to the owners of LLC Common Units in amounts
sufficient to (i) fund all or part of their tax obligations in respect of taxable income allocated to them, (ii) fund our dividend
and distribution policy as approved by our Board, and (iii) cover our operating expenses, including payments under the Tax
Receivable Agreement.
However, the LLC’s ability to make such distributions may be subject to various limitations and restrictions,
such as restrictions on distributions that would violate either any contract or agreement to which the LLC or its subsidiaries
is then a party, including debt agreements, or any applicable law, or that would have the effect of rendering the LLC or its
41
subsidiaries insolvent. For instance, the Credit Agreement and the indentures which govern the Senior Secured Notes
restrict certain of our subsidiaries’ ability to pay dividends to us, subject to certain exceptions, including if such
distributions meet certain requirements such as caps on amounts, pro forma leverage ratios, and absence of defaults
applicable to certain types of distributions, among others. If we do not have sufficient funds to pay tax or other liabilities or
to fund our operations, we may have to borrow funds, which could materially adversely affect our liquidity and financial
condition and subject us to various restrictions imposed by any such lenders. To the extent that we are unable to make
payments under the Tax Receivable Agreement, such payments generally will be deferred and will accrue interest until
paid. Nonpayment for a specified period, however, may constitute a breach of a material obligation under the Tax
Receivable Agreement and therefore accelerate payments due under the Tax Receivable Agreement, unless, generally, such
nonpayment is due to a lack of sufficient funds.
The Ryan Parties control us and their interests may conflict with or differ from the interests of our stockholders.
Each LLC Unitholder, other than the Company, has an equivalent number of shares of our Class B common
stock which are entitled to 10 votes per share. As of December 31, 2025, the Ryan Parties owned 83% of the shares of our
outstanding Class B common stock, thereby giving the Ryan Parties the ability to control the outcome of matters requiring
the approval of our stockholders, including the election of directors and significant corporate transactions, such as a merger
or other sale of our company or its assets. Even if the Ryan Parties own significantly less than a majority of the shares of
our outstanding Class A and Class B common stock, they will still have the ability to control the outcome of matters
requiring the approval of our stockholders. Because the Ryan Parties hold most of their economic ownership interest in our
business through the LLC, rather than through the public company, the Ryan Parties may have conflicting interests with
holders of shares of our Class A common stock. For example, the Ryan Parties may have different tax positions from us
which could influence their decisions regarding whether and when to dispose of assets and whether and when to incur new
or refinance existing indebtedness, especially in light of the existence of the Tax Receivable Agreement. In addition, the
structuring of future transactions may take into consideration these tax considerations or other considerations even where
no similar benefit would accrue to us.
Conflicts of interest could arise between our stockholders and the LLC Unitholders, which may impede business
decisions that could benefit our stockholders.
The LLC Unitholders, other than the Company, have the right to consent to certain amendments to the LLC
Operating Agreements, as well as to certain other matters. The LLC Unitholders may exercise these voting rights in a
manner that conflicts with the interests of our stockholders. Circumstances may arise in the future when the interests of the
LLC Unitholders conflict with the interests of our stockholders. As we control the LLC, we have certain obligations to the
LLC Unitholders that may conflict with fiduciary duties our officers and directors owe to our stockholders. These conflicts
may result in decisions that are not in the best interests of stockholders.
The Tax Receivable Agreement requires us to make cash payments to the current and certain former LLC Unitholders
in respect of certain tax benefits to which we may become entitled, and we expect that the payments we will be required
to make may be substantial.
In connection with the consummation of our IPO, we entered into a Tax Receivable Agreement with the current
and certain former LLC Unitholders. Pursuant to the Tax Receivable Agreement, we may be required to make cash
payments to the current and certain former LLC Unitholders, collectively, equal to 85% of the tax benefits, if any, that we
actually realize, or, in some circumstances, are deemed to realize, as a result of (i) certain increases in the tax basis of assets
of the LLC and its subsidiaries resulting from purchases or exchanges of LLC Common Units, (ii) certain tax attributes of
the LLC and subsidiaries of the LLC that existed prior to the IPO, (iii) certain favorable “remedial” partnership tax
allocations to which we become entitled (if any), and (iv) certain other tax benefits related to our entering into the Tax
Receivable Agreement, including tax benefits attributable to payments that we make under the Tax Receivable Agreement.
Due to the uncertainty of various factors, we cannot precisely quantify the likely tax benefits we will realize as a result of
the LLC Common Unit exchanges and the resulting amounts we are likely to pay out to the current or certain former LLC
Unitholders, collectively, pursuant to the Tax Receivable Agreement; however, as of December 31, 2025, the Company has
recorded Tax Receivable Agreement liabilities on the Consolidated Balance Sheets for the amount of $459.0 million
associated with the payments to be made to current and certain former LLC Unit holders subject to the TRA. Payments
under the Tax Receivable Agreement will be based on the tax reporting positions that we determine, which tax reporting
positions will be based on the advice of our tax advisors. Any payments made by us to the current and certain former LLC
Unitholders under the Tax Receivable Agreement will generally reduce the amount of overall cash flow that might have
otherwise been available to us. Furthermore, our future obligation to make payments under the Tax Receivable Agreement
could make us a less attractive target for an acquisition, particularly in the case of an acquirer that cannot use some or all of
42
the tax benefits that may be deemed realized under the Tax Receivable Agreement. The payments under the Tax
Receivable Agreement are also not conditioned upon the LLC Unitholders maintaining a continued ownership interest in
the LLC.
The actual amount and timing of any payments under the Tax Receivable Agreement will vary depending upon
a number of factors, including the timing of any future exchanges, the price of shares of our Class A common stock at the
time of any future exchanges, the extent to which such exchanges are taxable, the amount and timing of our income, and
applicable tax rates.
The amounts that we may be required to pay to the current and certain former LLC Unitholders under the Tax
Receivable Agreement may be accelerated in certain circumstances and may also significantly exceed the actual tax
benefits that we ultimately realize.
The Tax Receivable Agreement provides that if (i) certain mergers, asset sales, other forms of business
combination or other changes of control were to occur or (ii) we breach any of our material obligations under the Tax
Receivable Agreement, then the Tax Receivable Agreement will terminate and our obligations, or our successor’s
obligations, to make payments under the Tax Receivable Agreement would accelerate and become immediately due and
payable. The amount due and payable in that circumstance is based on certain assumptions, including an assumption that
we would have sufficient taxable income to fully utilize all potential future tax benefits that are subject to the Tax
Receivable Agreement. We may need to incur debt to finance payments under the Tax Receivable Agreement to the extent
our cash resources are insufficient to meet our obligations under the Tax Receivable Agreement as a result of timing
discrepancies or otherwise.
As a result of a change in control or a material breach of the Tax Receivable Agreement, (i) we could be
required to make cash payments to the current and certain former LLC Unitholders that are greater than the specified
percentage of the actual benefits we ultimately realize in respect of the tax benefits that are subject to the Tax Receivable
Agreement and (ii) we would be required to make an immediate cash payment equal to the anticipated future tax benefits
that are the subject of the Tax Receivable Agreement discounted in accordance with the Tax Receivable Agreement, which
payment may be made significantly in advance of the actual realization, if any, of such future tax benefits. In these
situations, our obligations under the Tax Receivable Agreement could have a substantial negative impact on our liquidity
and could have the effect of delaying, deferring, or preventing certain mergers, asset sales, other forms of business
combination, or other changes of control. There can be no assurance that we will be able to finance our obligations under
the Tax Receivable Agreement.
Our organizational structure, including the Tax Receivable Agreement, confers certain benefits upon the current and
certain former LLC Unitholders that do not benefit the other common stockholders to the same extent as they will
benefit the current and certain former LLC Unitholders.
Our organizational structure, including the Tax Receivable Agreement, confers certain benefits upon the current
and certain former LLC Unitholders that do not benefit the holders of our common stock to the same extent. We have
entered into a Tax Receivable Agreement with the current and certain former LLC Unitholders, which provides for the
payment by us to the current and certain former LLC Unitholders, collectively, of 85% of the amount of tax benefits, if
any, that we actually realize, or in some circumstances are deemed to realize, as a result of the Tax Attributes. Due to the
uncertainty of various factors, we cannot precisely quantify the likely tax benefits we will realize as a result of future
purchases of LLC Common Units and LLC Common Unit exchanges and the resulting amounts we are likely to pay out to
the current and certain former LLC Unitholders pursuant to the Tax Receivable Agreement. Although we will retain 15%
of the amount of such tax benefits that are actually realized, this and other aspects of our organizational structure may
adversely impact the future trading market for the Class A common stock.
We may not be able to realize all or a portion of the tax benefits that are currently expected to result from the Tax
Attributes covered by the Tax Receivable Agreement and from payments made under the Tax Receivable Agreement.
Our ability to realize the tax benefits that we currently expect to be available as a result of the Tax Attributes,
the payments made pursuant to the Tax Receivable Agreement, and the interest deductions imputed under the Tax
Receivable Agreement all depend on a number of assumptions, including that we earn sufficient taxable income each year
during the period over which such deductions are available and that there are no adverse changes in applicable law or
regulations. Additionally, if our actual taxable income were insufficient or there were additional adverse changes in
applicable law or regulations, we may be unable to realize all or a portion of the expected tax benefits and our cash flows
and stockholders’ equity could be negatively affected.
43
We will not be reimbursed for any payments made to the beneficiaries under the Tax Receivable Agreement in the event
that any purported tax benefits are subsequently disallowed by the IRS.
If the IRS or a state or local taxing authority challenges the tax basis adjustments and/or deductions that give
rise to payments under the Tax Receivable Agreement and the tax basis adjustments and/or deductions are subsequently
disallowed, the recipients of payments under the agreement will not reimburse us for any payments we previously made to
them. Any such disallowance would be taken into account in determining future payments under the Tax Receivable
Agreement and may, therefore, reduce the amount of any such future payments. Nevertheless, if the claimed tax benefits
from the tax basis adjustments and/or deductions are disallowed, our payments under the Tax Receivable Agreement could
exceed our actual tax savings, and we will not be able to recoup payments under the Tax Receivable Agreement that were
calculated on the assumption that the disallowed tax savings were available.
In certain circumstances, the LLC will be required to make distributions to the LLC Unitholders and the distributions
may be substantial.
The LLC is treated as a partnership for U.S. federal income tax purposes and, as such, is not subject to U.S.
federal income tax. Instead, taxable income is allocated to its members. The LLC is obligated to make tax distributions
quarterly to the LLC Unitholders (including us), in each case on a pro rata basis based on the LLC’s net taxable income and
without regard to any applicable basis adjustment under Section 743(b) of the Code and based on an assumed tax rate.
Funds used by the LLC to satisfy its tax distribution obligations will not be available for reinvestment in our business.
Moreover, these tax distributions may be substantial, and will likely exceed (as a percentage of the LLC’s income) the
overall effective tax rate applicable to a similarly situated corporate taxpayer. As a result, it is possible that we will receive
distributions significantly in excess of our tax liabilities and obligations to make payments under the Tax Receivable
Agreement. While our Board has approved the distribution of such cash balances as dividends on our Class A common
stock, it is not be required to do so, and may in its sole discretion choose to use such excess cash for other purposes
depending upon the facts and circumstances at the time of determination.
Unanticipated changes in effective tax rates or adverse outcomes resulting from examination of our income or other tax
returns could adversely affect our operating results and financial condition.
We are subject to income taxes in the United States, and our tax liabilities are subject to the allocation of
expenses in differing jurisdictions. Our future effective tax rates could be subject to volatility or adversely affected by a
number of factors, including:
•changes in the valuation of our deferred tax assets and liabilities;
•expected timing and amount of the release of any tax valuation allowances;
•expiration of, or detrimental changes in, research and development tax credit laws; or
•changes in tax laws, regulations, or interpretations thereof.
In addition, we may be subject to audits of our income, sales, and other transaction taxes by U.S. federal and
state authorities. Outcomes from these audits could have an adverse effect on our operating results and financial condition.
If we were deemed to be an investment company under the Investment Company Act of 1940, as amended (the “1940
Act”), applicable restrictions could make it impractical for us to continue our business as contemplated and could have
a material adverse effect on our business, financial condition, results of operations, cash flows, and prospects.
Interests in the LLC could be deemed to be “investment securities” under the 1940 Act. We conduct our
operations in a manner such that we believe we will not be deemed to be an investment company. However, if we were
deemed to be an investment company, restrictions imposed by the 1940 Act, including limitations on our capital structure
and our ability to transact with affiliates, could make it impractical for us to continue our business as contemplated and
could have a material adverse effect on our business, financial condition, results of operations, cash flows, and prospects.
Risks Related to Our Class A Common Stock
The dual-class structure of our common stock has the effect of concentrating voting control with the Ryan Parties,
which includes our founder and Executive Chairman, which limits your ability to influence the outcome of important
44
transactions, including a change in control, and the Ryan Parties interests’ may conflict with ours or yours in the
future.
Our Class B common stock has 10 votes per share, and our Class A common stock has one vote per share. As of
December 31, 2025, the Ryan Parties, which include our founder and Executive Chairman, control approximately 77% of
the voting power of our outstanding capital stock, which means that, based on their percentage voting power the Ryan
Parties control the vote of all matters submitted to a vote of our stockholders. This control enables the Ryan Parties to
control the election of the members of the Board and all other corporate decisions. Even when the Ryan Parties cease to
control a majority of the total voting power, for so long as the Ryan Parties continue to own a significant percentage of our
common stock, the Ryan Parties will still be able to significantly influence the composition of our Board and the approval
of actions requiring stockholder approval as set forth in a Director Nomination Agreement. Accordingly, for such period of
time, the Ryan Parties will have significant influence with respect to our management, business plans and policies,
including the appointment and removal of our officers, decisions on whether to raise future capital, and amending our
charter and bylaws which govern the rights attached to our common stock. In particular, for so long as the Ryan Parties
continue to own a significant percentage of our common stock, the Ryan Parties will be able to cause or prevent a change
of control of us or a change in the composition of our Board and could preclude any unsolicited attempt to acquire us. The
concentration of ownership could deprive you of an opportunity to receive a premium for your shares of Class A common
stock as part of a sale of the Company and ultimately might affect the market price of our Class A common stock.
In addition, we entered into a Director Nomination Agreement with the Ryan Parties and one of our pre-IPO
significant equity holders that provides the Ryan Parties the right to designate (in each instance, rounded up to the nearest
whole number if necessary): (i) all of the nominees for election to our Board for so long as the Ryan Parties control, in the
aggregate, 50% or more of the total number of shares of our common stock beneficially owned by the Ryan Parties upon
completion of our IPO, as adjusted for any reorganization, recapitalization, stock dividend, stock split, reverse stock split,
or similar changes in our capitalization (the “Original Amount”); (ii) 50% of the nominees for election to our Board for so
long as the Ryan Parties control, in the aggregate, more than 40%, but less than 50% of the Original Amount; (iii) 40% of
the nominees for election to our Board for so long as the Ryan Parties control, in the aggregate, more than 30%, but less
than 40% of the Original Amount; (iv) 30% of the nominees for election to our Board for so long as the Ryan Parties
control, in the aggregate, more than 20%, but less than 30% of the Original Amount; and (v) 20% of the nominees for
election to our Board for so long as the Ryan Parties control, in the aggregate, more than 10%, but less than 20% of the
Original Amount, which could result in representation on our Board that is disproportionate to the Ryan Parties’ beneficial
ownership. Upon the death or disability of Patrick G. Ryan, or at such time that he is longer on the Board or actively
involved in the operations of the Company, the Ryan Parties will no longer hold the nomination rights specified in (i)
through (v); however, the Ryan Parties will have the right to designate one nominee for so long as the Ryan Parties control,
in the aggregate, 10% or more of the Original Amount. In addition, for so long as the Ryan Parties hold the nomination
rights specified in (i) through (v), the Ryan Parties have the right to nominate the chairman of the Board. The Director
Nomination Agreement also provides that the Ryan Parties may assign such rights to an affiliate. The Director Nomination
Agreement prohibits us from increasing or decreasing the size of our Board without the prior written consent of the Ryan
Parties.
The Ryan Parties and their affiliates engage in a broad spectrum of activities, including investments in our
industry generally. In the ordinary course of their business activities, the Ryan Parties and their affiliates may engage in
activities where their interests conflict with our interests or those of our other stockholders, such as investing in or advising
businesses that directly or indirectly compete with certain portions of our business or are suppliers or clients of ours. Our
certificate of incorporation provides that none of the Ryan Parties, any of their affiliates or any director who is not
employed by us or our affiliates will have any duty to refrain from engaging, directly or indirectly, in the same business
activities or similar business activities or lines of business in which we operate. The Ryan Parties also may pursue
acquisition opportunities that may be complementary to our business, and, as a result, those acquisition opportunities may
not be available to us. In addition, the Ryan Parties may have an interest in pursuing acquisitions, divestitures, and other
transactions that, in their judgment, respectively, could enhance their investment, respectively, even though such
transactions might involve risks to you or may not prove beneficial.
Future transfers by the holders of LLC Common Units (who own an equal number of 10 votes per share Class B
common stock related thereto) will generally result in those shares converting into shares of Class A common stock and the
cancellation of the related Class B common stock, subject to limited exceptions, such as certain transfers effected for estate
planning or charitable purposes. For a description of the dual-class structure, see Exhibit 4.7 to this Annual Report.
45
Provisions of our corporate governance documents could make an acquisition of us more difficult and may prevent
attempts by our stockholders to replace or remove our current management, even if beneficial to our stockholders.
Our certificate of incorporation and bylaws and the Delaware General Corporation Law (the “DGCL”) contain
provisions that could make it more difficult for a third-party to acquire us, even if doing so might be beneficial to our
stockholders. Among other things:
•our dual-class common stock structure provides our holders of Class B common stock with the ability to
control the outcome of matters requiring stockholder approval;
•our certificate of incorporation allows us to authorize the issuance of undesignated preferred stock, the
terms of which may be established and the shares of which may be issued without stockholder approval,
and which may include supermajority voting, special approval, dividend, or other rights or preferences
superior to the rights of stockholders;
•our certificate of incorporation provides for a classified board of directors with staggered three-year terms,
which pursuant to a proposal that was approved at the Company’s 2025 annual meeting of stockholders, is
being phased out, such that the Class II directors who stand for election at our 2026 annual meeting of
stockholders will be elected for one-year terms, the Class III directors and the prior Class II directors will
stand for election for one-year terms at the 2027 annual meeting of stockholders, and all directors will stand
for election for one-year terms at the 2028 annual meeting of stockholders and at each annual meeting of
stockholders thereafter. Until declassification is complete, the Company’s classified Board could serve to
make it more difficult for a third-party to acquire us; and
•our bylaws establish advance notice requirements for nominations for elections to our Board or for
proposing matters that can be acted upon by stockholders at stockholder meetings; provided, however, at
any time when the Ryan Parties control, in the aggregate, at least 10% voting power of the common stock,
such advance notice procedure does not apply to the Ryan Parties.
We have opted out of Section 203 of the DGCL, which generally prohibits a Delaware corporation from
engaging in any of a broad range of business combinations with any interested stockholder for a period of three years
following the date on which the stockholder became an interested stockholder. However, our certificate of incorporation
contains a provision that provides us with protections similar to Section 203, and prevents us from engaging in a business
combination with a person (excluding the Ryan Parties and any of their direct or indirect transferees and any group as to
which such persons are a party) who acquires at least 15% of our common stock for a period of three years from the date
such person acquired such common stock, unless board or stockholder approval is obtained prior to the acquisition. These
provisions could discourage, delay, or prevent a transaction involving a change in control of our company. These
provisions could also discourage proxy contests and make it more difficult for you and other stockholders to elect directors
of your choosing and cause us to take other corporate actions you desire, including actions that you may deem
advantageous, or negatively affect the trading price of our Class A common stock. In addition, because our Board is
responsible for appointing the members of our management team, these provisions could in turn affect any attempt by our
stockholders to replace current members of our management team.
These and other provisions in our certificate of incorporation, bylaws, and Delaware law could make it more
difficult for stockholders or potential acquirers to obtain control of our Board or initiate actions that are opposed by our
then-current Board, including actions to delay or impede a merger, tender offer, or proxy contest involving our company.
The existence of these provisions could negatively affect the price of our Class A common stock and limit opportunities for
you to realize value in a corporate transaction.
For information regarding these and other provisions, see Exhibit 4.7 to this Annual Report.
Our certificate of incorporation designates the Court of Chancery of the State of Delaware as the exclusive forum for
certain litigation that may be initiated by our stockholders and the federal district courts of the United States as the
exclusive forum for litigation arising under the Securities Act, which could limit our stockholders’ ability to obtain a
favorable judicial forum for disputes with us.
Pursuant to our certificate of incorporation, unless we consent in writing to the selection of an alternative forum,
the Court of Chancery of the State of Delaware (or, if the Court of Chancery does not have jurisdiction, the United States
District Court for the District of Delaware) will, to the fullest extent permitted by law, be the sole and exclusive forum for
(i) any derivative action or proceeding brought on behalf of us, (ii) any action asserting a claim of breach of a fiduciary
duty owed by, or other wrongdoing by, any current or former director, officer, employee, or agent of ours owed to us or our
46
stockholders, or a claim of aiding and abetting any such breach of fiduciary duty, (iii) any action asserting a claim against
the Company or any director, officer, employee, or agent of ours arising pursuant to any provision of the DGCL, the
certificate of incorporation or the bylaws (as either may be amended, restated, modified, supplemented, or waived from
time to time) (iv) any action to interpret, apply, enforce, or determine the validity of the certificate of incorporation or the
bylaws (as either may be amended), (v) any action asserting a claim against the us or any director, officer, employee, or
agent of ours that is governed by the internal affairs doctrine, or (vi) any action asserting an “internal corporate claim” as
that term is defined in Section 115 of the DGCL. This provision would not apply to any action or proceeding asserting a
claim under the Securities Act or the Exchange Act for which the federal courts have exclusive jurisdiction or any other
claim for which the federal courts have exclusive jurisdiction. Furthermore, our certificate of incorporation also provides
that, unless we consent in writing to the selection of an alternative forum, the federal district courts of the United States
will be the sole and exclusive forum for the resolution of any complaint asserting a cause of action arising under the
Securities Act of 1933, against us or any director, officer, employee, or agent of ours. However, Section 22 of the
Securities Act creates concurrent jurisdiction for federal and state courts over all suits brought to enforce a duty or liability
created by the Securities Act or the rules and regulations thereunder; accordingly, we cannot be certain that a court would
enforce such provision. Our certificate of incorporation further provides that any person or entity purchasing or otherwise
acquiring any interest in shares of our capital stock is deemed to have notice of and consented to the provisions of our
certificate of incorporation described above; however, our stockholders will not be deemed to have waived our compliance
with the federal securities laws and the rules and regulations thereunder. The forum selection provisions in our certificate
of incorporation may have the effect of discouraging lawsuits against us or our directors and officers and may limit our
stockholders’ ability to obtain a favorable judicial forum for disputes with us. If the enforceability of our forum selection
provision were to be challenged, we may incur additional costs associated with resolving such a challenge. While we
currently have no basis to expect any such challenge would be successful, if a court were to find our forum selection
provision to be inapplicable or unenforceable, we may incur additional costs associated with having to litigate in other
jurisdictions, which could have an adverse effect on our business, financial condition, and results of operations and result in
a diversion of the time and resources of our employees, management, and Board.
Future sales, or the possibility of future sales, of a substantial number of our shares of Class A common stock could
adversely affect the price of our shares of Class A common stock.
Future sales of a substantial number of our shares of Class A common stock, or the perception that such sales
will occur, could cause a decline in the market price of our shares of Class A common stock. As of December 31, 2025, a
significant number of Class A common stock (or LLC Common Units exchangeable for Class A common stock) were held
by certain of our pre-IPO equity holders which are not otherwise, or are no longer, subject to either vesting or other sales
restrictions imposed by the Company. If these stockholders sell substantial amounts of shares of Class A common stock in
the public market (including any shares of Class A common stock issued upon the exchange of LLC Common Units), or
the market perceives that such sales may occur, the market price of our shares of Class A common stock could be adversely
affected. We have also entered into the registration rights agreement pursuant to which we have agreed under certain
circumstances to file a registration statement to register the resale of shares of our Class A commons stock held by the
Ryan Parties, as well as to cooperate in certain public offerings of such shares. We have also filed registration statements to
register all shares of Class A common stock and other equity securities that we have issued, or may issue, under the
Company’s 2021 Omnibus Incentive Plan. These shares of Class A common stock may be freely sold in the public market
upon issuance, subject to vesting and certain limitations imposed by us and as applicable to affiliates. If a large number of
our shares of Class A common stock are sold in the public market, the sales could reduce the trading price of shares of
Class A common stock.
We cannot guarantee that our share repurchase program will be fully consummated or that it will enhance long-term
shareholder value. Share repurchases could also affect the trading price of our Class A stock, increase volatility of our
stock and diminish our cash reserves.
Although our Board of Directors has authorized a share repurchase program that does not have an expiration
date, the program does not obligate us to repurchase any specific number of shares of our Class A common stock. We
cannot guarantee that the program will be fully consummated or that it will enhance long-term stockholder value. The
timing and number of shares repurchased under the program will depend on a variety of factors, including the Company’s
stock price, trading volume, working capital or other liquidity requirements, and market conditions, and may be suspended
or discontinued at any time without notice. The program could affect the trading price of our Class A common stock,
increase volatility and diminish our cash balance. Our Board of Directors will review the program periodically and may
47
authorize adjustments of its terms if appropriate. Any announcement of a suspension or termination of this program may
result in a decrease in the trading price of our Class A stock.
There can be no assurance that we will declare additional cash dividends.
On February 27, 2024, we announced our first cash dividend and have paid a dividend every quarter since then.
The payment of any cash dividends in the future is subject to continued capital availability, market conditions, applicable
laws and agreements, and our Board continuing to determine that the declaration of dividends is in the best interests of our
stockholders. The declaration and payment of any dividend may be discontinued or reduced at any time, and there can be
no assurance that we will declare additional cash dividends in the future in any particular amounts, or at all.
We may issue shares of preferred stock in the future, which could make it difficult for another company to acquire us or
could otherwise adversely affect holders of our Class A common stock, which could depress the price of our Class A
common stock.
Our certificate of incorporation authorizes us to issue one or more series of preferred stock. Our Board has the
authority to determine the preferences, limitations, and relative rights of the shares of preferred stock and to fix the number
of shares constituting any series and the designation of such series, without any further vote or action by our stockholders.
Our preferred stock could be issued with voting, liquidation, dividend, and other rights superior to the rights of our Class A
common stock. The potential issuance of preferred stock may delay or prevent a change in control of us, discouraging bids
for our Class A common stock at a premium to the market price, and materially adversely affect the market price and the
voting and other rights of the holders of our Class A common stock.
Our operating results and stock price may be volatile.
Our quarterly operating results are likely to fluctuate in the future. In addition, securities markets worldwide
have experienced, and are likely to continue to experience, significant price and volume fluctuations. Our operating results
and the trading price of our Class A common stock may fluctuate in response to various factors, including:
•market conditions in our industry or the broader stock market;
•actual or anticipated fluctuations in our quarterly financial and operating results;
•introduction of new products or services by us or our competitors;
•issuance of new or changed securities analysts’ reports or recommendations;
•sales, or anticipated sales, of large blocks of our stock;
•additions or departures of key personnel;
•regulatory or political developments;
•litigation and governmental investigations;
•changing economic conditions (including inflationary pressures and any related interest rate volatility);
•investors’ perception of us;
•events beyond our control such as weather, war, and health crises; and
•any default on our indebtedness.
These and other factors, many of which are beyond our control, may cause our operating results and the market
price and demand for our Class A common stock to fluctuate substantially. Fluctuations in our quarterly operating results
could limit or prevent investors from readily selling their shares of Class A common stock and may otherwise negatively
affect the market price and liquidity of our shares of Class A common stock. In addition, in the past, when the market price
of a stock has been volatile, holders of that stock have sometimes instituted securities class action litigation against the
company that issued the stock. If any of our shareholders brought a lawsuit against us, we could incur substantial costs
defending the lawsuit. Such a lawsuit could also divert the time and attention of our management from our business, which
could significantly harm our profitability and reputation.
48
ITEM 1B. UNRESOLVED STAFF COMMENTS
None.
ITEM 1C. CYBERSECURITY
All companies that maintain sensitive or confidential data or utilize technology are subject to the threat of
unauthorized persons gaining unapproved access to systems or components of systems. In order to mitigate this threat to
our business, we take a comprehensive approach to cybersecurity risk management. We have devoted significant resources
to implement and maintain cybersecurity measures to meet regulatory requirements and the expectations of our clients,
trading partners, and other stakeholders. We intend to continue to evolve our cybersecurity defenses and strategy and to
make significant investments to maintain the security of our data and cybersecurity infrastructure.
We face a number of cybersecurity risks in connection with our business. As of the date of this report, we are
not aware of any cybersecurity incidents that materially impacted the Company in the last three years. Although such risks
have not materially affected us, including our business strategy, results of operations or financial condition to date, we
have, from time to time, experienced threats to and unauthorized persons gaining unapproved access to, including breaches
of, our data and systems, including insider threats and phishing attacks. For more information about the cybersecurity risks
we face, see “Risk Factors – We rely on the efficient, uninterrupted, and secure operation of complex information
technology systems and networks to operate our business. Any significant system or network disruption due to a breach in
the security of our information technology systems could have a negative impact on our reputation, regulatory compliance
status, operations, sales, and operating results” included elsewhere in this Annual Report
Risk Management and Strategy
Ryan Specialty’s processes for assessing, identifying, and managing material risks from cybersecurity threats is
integrated into our overall enterprise risk management program, which is overseen by the Audit Committee of the Board
(the “Audit Committee”). The Audit Committee is charged with reviewing our cybersecurity processes for assessing key
strategic, operational and compliance risks. The Audit Committee then provides updates on significant cybersecurity
matters to the Board periodically. We have established comprehensive cybersecurity policies, standards, processes,
practices, and controls to mitigate the risk of cyber threats, and we continually invest in prevention and detection
technology and employee training to enhance our cybersecurity posture. Our cybersecurity risk management program
leverages and strives to align with the U.S. National Institute of Standards and Technology Cybersecurity Framework,
which organizes cybersecurity risks into five categories: identify, protect, detect, respond, and recover.
Collaboration
Our cybersecurity risks are identified and addressed through a comprehensive, cross-functional approach. Key
security, risk, legal, compliance, IT, and business leaders meet regularly to develop strategies for preserving the
confidentiality, integrity, and availability of Company, employee, and third-party information provided to us; identifying,
preventing, and mitigating cybersecurity threats; and effectively responding to cybersecurity incidents. We maintain
controls and procedures that are designed to ensure prompt escalation of certain cybersecurity incidents so that decisions
regarding legal and regulatory compliance, public disclosure, and reporting of such incidents can be made by management
and presented to the Audit Committee and the Board, as necessary, in a timely manner.
Risk Assessment and Technical Safeguards
Our Information Security Steering Committee (the “Security Committee”), which is led by our Company’s
Chief Information Security Officer (“CISO”), meets quarterly to prioritize and align actions with business priorities,
manage issues, and respond to changes in regulatory requirements. At least annually, we conduct a cybersecurity risk
assessment that takes into account information from internal stakeholders, known security vulnerabilities, and information
from external sources (e.g., reported security incidents that have impacted other companies, industry trends, and
evaluations by third parties and consultants) and includes a tabletop exercise and external and internal penetration testing.
The results of the assessment are used to drive alignment on, and prioritization of, initiatives to enhance our preventive and
detective security controls, make recommendations to improve processes, and inform a broader enterprise-level risk
assessment that is presented to members of management, the Audit Committee, which is comprised solely of independent
directors, and the Board, when necessary. Throughout the year we do vulnerability testing. We regularly assess and deploy
technical safeguards designed to protect our information systems from cybersecurity threats. Such safeguards are regularly
evaluated and improved based on industry best practices, vulnerability assessments, cybersecurity threat intelligence, input
from consultants, and incident response experience.
49
Monitoring and Incident Response Plan
Information Security risks are monitored by our security operations center team along with managed services
providing 24x7x365 monitoring and response. Ryan Specialty retains third-party resources with a leading cybersecurity
company for incident response when needed, including remediation. We apply lessons learned from our defense and
monitoring efforts to help manage and prevent future incidents. We have established a comprehensive incident response
plan that is regularly tested and evaluated to confirm its effectiveness. In the event our CISO determines a cybersecurity
incident needs to be escalated, she engages our critical escalation team who, with the assistance of third-party consultants,
will make the determination as to whether the incident is material and whether escalation to senior management, the Audit
Committee, and/or the Board is required.
Third-Party Risk Assessments
We conduct information security assessments before sharing or allowing the hosting of sensitive data in
computing environments managed by third parties, and our standard terms and conditions contain contractual provisions
requiring certain security protections and require those vendors and providers, that meet certain risk profiles, to meet
appropriate security requirements, controls, and responsibilities.
Education and Awareness
Our policies require each of our employees to contribute to our data security efforts. We regularly remind
employees of the importance of properly handling and protecting Company, employee, and third-party data, including
through annual privacy and security training to enhance employee awareness of how to recognize, detect, and respond to
cybersecurity threats. In addition to the annual training requirements, we regularly send employees mock phishing emails
to test their ability to assess incoming email threats.
For companies that we acquire, our integration efforts include, where appropriate, workable timelines for
alignment on information security, data privacy, cybersecurity, and employee education.
Governance
Board Oversight
The Audit Committee oversees our overall enterprise risk assessment and risk management policies including
risks related to cybersecurity. The Board and Audit Committee set the tone at the top by providing oversight and
establishing expectations for the overall effectiveness and efficiency of the information security program. Each quarter, our
CISO provides a quarterly update to the Audit Committee about our cybersecurity program, including detection,
mitigation, and remediation of significant incidents, if any, that occurred during the quarter. Additionally, on an annual
basis, the CISO delivers reports to the Board and Audit Committee with an annual cybersecurity risk assessment that
includes information concerning the prevention, detection, mitigation, and remediation of cybersecurity incidents, if any,
including material security risks and information security vulnerabilities. The Audit Committee provides a quarterly
summary of all important issues to the full Board.
In addition, if warranted based on our response plan, cyber security incidents will be escalated to the attention
of the Audit Committee while such incidents are ongoing.
Management’s Role
Primary responsibility for assessing and managing our cybersecurity risks rests with our CISO, who reports to
our Co-President and Chief Operating Officer. Both are members of our Security Steering Committee, which is a
governing body that drives alignment on security decisions across the Company. The Security Steering Committee includes
management across the departments and functions of the organization to enable transparency and alignment with the
business’ strategic goals and objectives. The Security Steering Committee has many years of valuable business experience
managing risks and developing and implementing cybersecurity policies and procedures. Our CISO has extensive
experience in information security, managing cybersecurity programs and cybersecurity risks, and has served in various
roles in information technology and information security for almost 30 years, including serving as the CISO at another
large public company. She holds an undergraduate degree in Information and Decision Sciences.
50
ITEM 2. PROPERTIES
Our corporate headquarters are in Chicago, Illinois, where we currently lease just under 50,000 square feet of
office space under a leased space that incorporates our remote work flexibility into our post-pandemic operating model and
we will continue to look at all of our offices to maximize size and efficiency. We have office locations in 33 U.S. states as
well as in the United Kingdom, Europe, Canada, Australia, the United Arab Emirates, India, and Singapore where, as of
December 31, 2025, we lease a total of approximately 1,180,000 square feet. We believe that our facilities are adequate for
our current needs.
ITEM 3. LEGAL PROCEEDINGS
From time to time, we may be involved in various legal proceedings and subject to claims that arise in the
ordinary course of business. Although the results of litigation and claims are inherently unpredictable and uncertain, we are
not presently a party to any litigation the outcome of which, we believe, if determined adversely to us, would individually
or taken together have a material adverse effect on our business, operating results, cash flows, or financial condition. For
further information, please see “Note 15, Commitments and Contingencies” in the footnotes to the consolidated financial
statements in this Annual Report.
ITEM 4. MINE SAFETY DISCLOSURE
Not applicable.
51
PART II
ITEM 5. MARKET FOR REGISTRANT’S COMMON EQUITY, RELATED STOCKHOLDER MATTERS, AND
ISSUER PURCHASES OF EQUITY SECURITIES
Share Data
Our shares of Class A common stock, $0.001 par value per share, are traded on the New York Stock Exchange
under the trading symbol RYAN. Our Class B common stock is not listed nor traded on any stock exchange.
On February 9, 2026, we had approximately 132 stockholders of record of our Class A common stock and 75
stockholders of record of our Class B common stock.
Dividend Policy
Prior to 2024, we had never declared or paid any cash dividend on our Class A common stock. On February 27,
2024, our Board declared a one-time special cash dividend of $0.23 per share on our outstanding Class A common stock. In
addition, the Board initiated a regular quarterly dividend of $0.11 per share on our outstanding Class A common stock.
Both the special and regular quarterly dividend were paid on March 27, 2024. The Board declared and we paid a regular
dividend of $0.11 per share in each subsequent quarter during 2024. The Board increased the regular dividend to $0.12 per
share at the beginning of 2025 and we paid a regular quarterly dividend of $0.12 per share in each subsequent quarter of
2025. On February 12, 2026, the Board declared a regular dividend of $0.13 per share to be paid on March 10, 2026, to
shareholders of record on February 24, 2026.
We intend to pay the regular quarterly dividend of $0.13 per share of Class A common stock going forward.
The payment of future cash dividends is subject to future declaration by our Board, which will be based in part on
continued capital availability, market conditions, applicable laws and agreements, and our Board continuing to determine
that the declaration of dividends is in the best interests of our stockholders. Additionally, because we are a holding
company, our ability to pay dividends on our Class A common stock may be limited by restrictions on the ability of our
subsidiaries to pay dividends or make distributions to us. Any future determination to pay dividends will be at the
discretion of our Board, subject to compliance with covenants in current and future agreements governing our and our
subsidiaries’ indebtedness, including our Credit Agreement and the indenture which governs our Senior Secured Notes, and
will depend on our results of operations, financial condition, capital requirements, and other factors that our Board deems
relevant.
Under the terms of the LLC Operating Agreement, the LLC is obligated to make tax distributions to current and
future LLC Unitholders, including us, with such distributions to be made on a pro rata basis among the LLC Unitholders
based on the LLC’s net taxable income and without regard to any applicable basis adjustment under Section 743(b) of the
Code. These tax distributions may be substantial and will likely exceed (as a percentage of the LLC’s income) the overall
effective tax rate applicable to a similarly situated corporate taxpayer. As a result, it is possible that we will receive
distributions significantly in excess of our tax liabilities and obligations to make payments under the Tax Receivable
Agreement.
While the Board has chosen to initiate a regular $0.13 cash dividend per share of Class A common stock in the
first quarter of 2026, it is not required to do so and may in the future, in its sole discretion, choose to use such excess cash
for any other purpose depending upon the facts and circumstances at the time of determination.
Related Stockholder Matters
Purchases of Equity Securities by the Issuer and Affiliated Purchasers
We did not repurchase any of our equity securities during the fourth quarter of the fiscal year covered by this
report.
Recent sale of Unregistered Securities
In connection with the acquisition of Stewart Specialty Risk Underwriting Ltd., the Company issued 139,392
shares of the Company’s Class A common stock on December 1, 2025, to certain owners of the acquired business at a price
of $49.00 per share. The issuance was made in reliance on the exemption from the registration requirements of the
52
Securities Act set forth in Section 903 of Regulation S promulgated thereunder for the issuance of the shares to non-U.S.
persons through offshore transactions which were negotiated and consummated outside the United States.
Stock Performance Graph
The following graph illustrates the total return from July 22, 2021, the first trading date of our Class A common
stock after our IPO, through December 31, 2025, for (i) our Class A common stock, (ii) the Standard and Poor’s 500 Index,
and (iii) the Standard and Poor’s 500 Financials Sector Index, assuming an investment of $100 on July 22, 2021, including
the reinvestment of dividends:
Securities Authorized for Issuance Under Equity Compensation Plans
Information relating to the compensation plans under which equity securities of the Company are authorized for
issuance is set forth under Part III, Item 12 “Security Ownership of Certain Beneficial Owners and Management and
Related Stockholder Matters” of this Annual Report and is incorporated herein by reference.
ITEM 6. [RESERVED]
53
ITEM 7. MANAGEMENT’S DISCUSSION AND ANALYSIS OF FINANCIAL CONDITION AND RESULTS OF
OPERATIONS
The following discussion and analysis summarizes the significant factors affecting the consolidated operating
results, financial condition, liquidity, and cash flows of the Company as of and for the periods presented below. The
following discussion and analysis should be read in conjunction with our Consolidated Financial Statements and the
related notes included elsewhere in this Annual Report on Form 10-K. The discussion contains forward-looking statements
that are based on the beliefs of management, as well as assumptions made by, and information currently available to, our
management. Actual results could differ materially from those discussed in or implied by forward-looking statements as a
result of various factors, including those discussed below and in the sections entitled “Risk Factors” and “Information
Concerning Forward-Looking Statements”.
The following discussion provides commentary on the financial results derived from our audited financial
statements for the years ended December 31, 2025, 2024, and 2023, prepared in accordance with U.S. GAAP. In addition,
we regularly review the following Non-GAAP measures when assessing performance: Organic revenue growth rate,
Adjusted compensation and benefits expense, Adjusted compensation and benefits expense ratio, Adjusted general and
administrative expense, Adjusted general and administrative expense ratio, Adjusted EBITDAC, Adjusted EBITDAC
margin, Adjusted net income, Adjusted net income margin, and Adjusted diluted earnings per share. See “Non-GAAP
Financial Measures and Key Performance Indicators” for further information.
Overview
Founded by Patrick G. Ryan in 2010, we are a service provider of specialty products and solutions for insurance
brokers, agents, and carriers. We provide distribution, underwriting, product development, administration, and risk
management services by acting predominantly as a wholesale broker and a managing underwriter or a program
administrator with delegated authority from insurance carriers. Our mission is to provide industry-leading innovative
specialty insurance solutions for insurance brokers, agents, and carriers.
For retail insurance agents and brokers, we assist in the placement of complex or otherwise hard-to-place risks.
For insurance and reinsurance carriers, we predominantly work with retail and wholesale insurance brokers to source,
onboard, underwrite, and service these same types of risks. A significant majority of the premiums we place are bound in
the E&S market, which includes Lloyd’s of London. There is often significantly more flexibility in terms, conditions, and
rates in the E&S market relative to the Admitted or “standard” insurance market. We believe that the additional freedom to
craft bespoke terms and conditions in the E&S market allows us to best meet the needs of our trading partners, provide
unique solutions, and drive innovation. We believe our success has been achieved by providing best-in-class intellectual
capital, leveraging our trusted and long-standing relationships, and developing differentiated solutions at a scale unmatched
by many of our competitors.
Significant Events and Transactions
Corporate Structure
We are a holding company and our sole material asset is a controlling equity interest in New LLC, which is also
a holding company and its sole material asset is a controlling equity interest in the LLC. The Company operates and
controls the business and affairs of, and consolidates the financial results of, the LLC through New LLC. We conduct our
business through the LLC. As the LLC is substantively the same as New LLC, for the purpose of this discussion we will
refer to both New LLC and the LLC as the “LLC”.
The LLC is a limited liability company taxed as a partnership for income tax purposes, and its taxable income
or loss is passed through to its members, including the Company. The LLC is subject to income taxes on its taxable income
in certain foreign countries, in certain state and local jurisdictions that impose income taxes on partnerships, and on the
taxable income of its U.S. corporate subsidiaries. As a result of our ownership of LLC Common Units, we are subject to
U.S. federal, state, and local income taxes with respect to our allocable share of any taxable income of the LLC and are
taxed at the prevailing corporate tax rates. We intend to cause the LLC to make distributions in an amount that is at least
sufficient to allow us to pay our tax obligations and operating expenses, including distributions to fund any ordinary course
payments due under the Tax Receivable Agreement. See “Liquidity and Capital Resources - Tax Receivable Agreement”
for additional information about the TRA.
54
Empower Program
In the first quarter of 2026 we are initiating a three-year restructuring program (the "Empower Program") that
will streamline our brokerage, binding, and underwriting operations, optimize our scale, accelerate our data and technology
strategies, and enhance efficiencies across all of our specialties. The program is estimated to result in approximately $160
million of cumulative one-time charges through 2028, and we expect it to generate annual savings of approximately $80
million in 2029. Actions taken under the Empower Program are expected to be completed by the end of 2028.
Acquisitions
On February 3, 2025, the Company completed the acquisition of Velocity Risk Underwriters, LLC
(“Velocity”), an MGU specializing in first-party insurance coverage for catastrophe exposed properties, based in Nashville,
Tennessee.
On May 1, 2025, the Company completed the acquisition of USQRisk Holdings, LLC, a company that
underwrites, structures, prices, and places specialty insurance for corporate clients seeking bespoke, multi-year risk
solutions based in New York and London.
On May 16, 2025, the Company completed the acquisition of 360° Underwriting, an MGU specializing in
commercial construction, based in Dublin and Galway, Ireland.
On July 1, 2025, the Company completed the acquisition of certain assets of J.M. Wilson Corporation (“JM
Wilson”), a binding authority and surplus lines broker specializing in transportation insurance, headquartered in Portage,
Michigan.
On December 1, 2025, the Company completed the acquisition of Stewart Specialty Risk Underwriting Ltd., an
MGU specializing in underwriting large-account, high-hazard property and casualty solutions, based in Toronto, Canada.
We believe these acquisitions complement our product capabilities, enhance our human capital, expand our
total addressable market, and provide us access to new markets in new geographies. See “Note 4, Mergers and
Acquisitions” in the footnotes to the consolidated financial statements in this Annual Report for further discussion.
Key Factors Affecting Our Performance
Our historical financial performance has been, and we expect our financial performance in the future to be,
driven by our ability to:
Pursue Strategic Acquisitions
We have successfully integrated businesses complementary to our own to increase both our distribution reach
and our product and service capabilities. We continuously evaluate acquisitions and intend to further pursue targeted
acquisitions that complement our product and service capabilities or provide us access to new markets. We have previously
made, and intend to continue to make, acquisitions with the objective of enhancing our human capital and product and
service capabilities, entering natural adjacencies, and expanding our geographic presence. Our ability to successfully
pursue strategic acquisitions is dependent upon a number of factors, including sustained execution of a disciplined and
selective acquisition strategy which requires acquisition targets to have a cultural and strategic fit, competition for these
assets, purchase price multiples that we deem appropriate and our ability to effectively integrate targeted companies or
assets and grow our business. We do not have agreements or commitments for any material acquisitions at this time.
Deepen and Broaden our Relationships with Retail Broker Trading Partners
We have deep engagement with our retail broker trading partners, and we believe we have the ability to transact
in even greater volume with nearly all of them. For example, in 2024, our revenue derived from the Top 100 firms (as
ranked by Business Insurance) expanded faster than our Organic revenue growth rate of 10.1%. Our ability to deepen and
broaden relationships with our retail broker trading partners and increase sales is dependent upon a number of factors,
including client satisfaction with our distribution reach and our product capabilities, retail brokers continuing to require or
desire our services, competition, pricing, economic conditions, and spending on our product offerings.
55
Build Our Delegated Authority Business
We believe there is substantial opportunity to continue to grow our Delegated Authority business, which
includes both our Binding Authority Specialty and Underwriting Management Specialty. We believe that both M&A
consolidation and panel consolidation have a long runway. We believe that both M&A consolidation and the use and
reliance on scaled delegated Underwriting Management will continue to grow. Our ability to grow this business is
dependent upon a number of factors, including a continuing ability to secure sufficient capital support from insurers, the
quality of our services and product offerings, marketing and sales efforts to drive new business prospects and execution,
new product offerings, the pricing and quality of our competitors’ offerings, and the growth in demand for the insurance
products.
Invest in Operations and Growth
We have invested heavily in building a durable business that is able to adapt to the continuously evolving
specialty and E&S markets and intend to continue to do so. We are focused on enhancing the breadth of our product and
service offerings as well as developing and launching new solutions to address the evolving needs of the specialty
insurance industry and markets. Our future success is dependent upon a number of factors, including our ability to
successfully develop, market, and sell existing and new products and services to both new and existing trading partners.
We will continue to prioritize strategic investments that support revenue growth such as investments in talent, de novo
formations, product innovation and solutions, M&A, and technology in order to maximize long-term value creation, which
could have a short-term margin impact.
The Empower Program initiated in the first quarter of 2026 is designed to enhance efficiencies across all of our
specialties. The efficiencies we gain through the Empower Program are expected to allow us to continue making strategic
investments in growth, top-tier talent, de novo formations, and address the rapidly evolving needs of our clients.
Generate Commission Regardless of the State of the Specialty and E&S Markets
We earn commissions, which are calculated as a percentage of the total insurance policy premium, and fees.
Changes in the insurance market or specialty lines that are our focus, characterized by a period of increasing (or declining)
premium rates, could positively (or negatively) impact our profitability.
Managing Changing Macroeconomic Conditions
Growth in certain lines of business, such as project-based construction and M&A transactional liability
insurance, is partially dependent on a variety of macroeconomic factors inasmuch as binding the underlying insurance
coverage is subject to the underlying activity occurring. In periods of economic growth, liquid credit markets, and
favorable interest rates, this underlying activity can accelerate and provide tailwinds to our growth. In periods of economic
decline, tight credit markets, and unfavorable interest rates, this underlying activity can slow or be delayed and provide
headwinds to our growth. We believe over the long term these lines of business will continue to grow.
Leverage the Growth of the Specialty and E&S Markets
The growing relevance of the specialty and E&S markets has been driven by the rapid emergence and sustained
prevalence of large, complex, high-hazard, and otherwise hard-to-place risks across many lines of insurance. This trend
continued in 2025, with $125 billion of insured catastrophe losses, driven by $52 billion of insured losses related to severe
convective storms (“SCS”) with 19 SCS events that caused losses in excess of $1 billion, which together accounted for the
third-highest annual total for insured losses on record for SCS events and over $41 billion in losses generated from
California wildfires. The year also included floods in central Texas and the Mississippi valley, causing over 135 fatalities
and over $3 billion in insured losses. Additionally, these risks include the potential for more severe hurricanes that occur
with greater frequency, more devastating wildfires, more frequent flooding, escalating jury verdicts and social inflation,
geographic shifts in population density, a proliferation of cyber threats, novel health risks, risks associated with large sports
and entertainment venues, building and labor cost inflation relative to insured value, and the transformation of the economy
to a “digital first” mode of doing business. We believe that as the complexity of the specialty and E&S markets continues
to escalate, wholesale brokers and managing underwriters that do not have sufficient scale, or the financial and intellectual
capital to invest in the required specialty capabilities, will struggle to compete effectively. This will further the trend of
market share consolidation among the wholesale firms that do have these capabilities. We will continue to invest in our
intellectual capital to innovate and offer custom solutions and products to better address these evolving market
fundamentals.
56
Although we believe this growth will continue, we recognize that the growth of the specialty and E&S markets
might not be linear as risks can and do shift between the E&S, including the specialty market, and non-E&S markets as
market factors change and evolve. For example, we benefited from a rapid increase in both the flow of property risks into
the wholesale channel and the premium rate charged for those risks in 2023 and the first half of 2024 as the frequency and
severity of catastrophe losses, attritional losses and secondary perils such as severe convective storms, economic inflation,
concentration of exposures, higher retentions of risk, and higher reinsurance costs applied pressure to insurers and capacity
tightened. In the second half of 2024 and throughout 2025, the specialty and E&S markets experienced a shift in these
trends as insurance capacity for these property risks increased, which resulted in a decline in property premium rates. We
believe these factors have created additional opportunities for retailers to place property coverage directly, and we believe
the market dynamics exist for these factors to potentially continue into 2026.
Components of Results of Operations
Revenue
Net Commissions and Fees
Net commissions and fees are derived primarily from our three Specialties and are paid for our role as an
intermediary in facilitating the placement of coverage in the insurance distribution chain. Net commissions and policy fees
are generally calculated as a percentage of the total insurance policy premium placed, although fees can often be a fixed
amount irrespective of the premium, and we also receive supplemental commissions based on the volume placed or
profitability of a book of business. We share a portion of these net commissions and policy fees with the retail insurance
broker and recognize revenue on a net basis. Additionally, carriers may also pay us a contingent commission or volume-
based commission, both of which represent forms of contingent or supplemental consideration associated with the
placement of coverage and are based primarily on underwriting results, but may also contain considerations for only
volume, growth, and/or retention. Although we have compensation arrangements called contingent commissions in all
three Specialties that are based in whole or in part on the underwriting performance, we do not take any direct insurance
risk other than through our equity method investments in Geneva Re through Ryan Investment Holdings, LLC and
Velocity Specialty Insurance Company (“VSIC”). We also receive loss mitigation and other fees, some of which are not
dependent on the placement of a risk.
In our Wholesale Brokerage and Binding Authority Specialties, we generally work with retail insurance brokers
to secure insurance coverage for their clients, who are the ultimate insured party. Our Wholesale Brokerage and Binding
Authority Specialties generate revenues through commissions and fees from clients, as well as through supplemental
commissions, which may be contingent commissions or volume-based commissions from carriers. Commission rates and
fees vary depending upon several factors, which may include the amount of premium, the type of insurance coverage
provided, the particular services provided to a client or carrier, and the capacity in which we act. Payment terms are
consistent with current industry practice.
In our Underwriting Management Specialty, we utilize delegated authority granted to us by carriers and we
work with retail insurance brokers or wholesale brokers to secure insurance coverage for the ultimate insured party. Our
Underwriting Management Specialty generates revenues through insurance and reinsurance commissions and fees from
clients and through contingent commissions from carriers. Commission rates and fees vary depending upon several factors
including the premium, the type of coverage, and additional services provided to the client. Payment terms are consistent
with current industry practice.
Fiduciary Investment Income
Fiduciary investment income consists of interest earned on insurance premiums and surplus lines taxes that are
held in a fiduciary capacity, in cash and cash equivalents, until disbursed.
Expenses
Compensation and Benefits
Compensation and benefits is our largest expense. It consists of (i) salary, incentives and benefits to employees,
and commissions to our producers and (ii) equity-based compensation associated with the grants of awards to employees,
executive officers, and directors. We operate in competitive markets for human capital and we need to maintain
competitive compensation levels in order to maintain and grow our talent base.
57
General and Administrative
General and administrative expense includes travel and entertainment expenses, information technology,
occupancy-related expenses, foreign exchange, legal, insurance and other professional fees, and other costs associated with
our operations. In particular, our travel and entertainment expenses, information technology expenses, occupancy-related
expenses, and professional services expenses generally increase or decrease in relative proportion to the number of our
employees and the overall size and scale of our business operations.
Amortization
Amortization expense consists primarily of amortization related to intangible assets we acquired in connection
with our acquisitions. Intangible assets consist of customer relationships, trade names, assembled workforce, and internally
developed software.
Interest Expense, Net
Interest expense, net consists of interest payable on indebtedness, amortization of the Company’s interest rate
cap, imputed interest on contingent consideration, and amortization of deferred debt issuance costs, offset by interest
income on the Company’s Cash and cash equivalents balances and payments received in relation to the interest rate cap.
Other Non-Operating Loss (Income)
For year ended December 31, 2025, Other non-operating loss (income) consisted of seller reimbursement of
acquisition-related retention incentives, sublease income, and forfeitures of vested equity awards offset by TRA contractual
interest and related charges. For the year ended December 31, 2024, Other non-operating loss (income) included expense
related to Term Loan modifications and TRA contractual interest and related charges offset by income related to a decrease
in our blended state tax rates and foreign tax credit impact on the TRA remeasurement and sublease income. For the year
ended December 31, 2023, Other non-operating loss (income) included charges related to the change in the TRA liability
caused by a change in our blended state tax rates.
Income Tax Expense
Income tax expense includes tax on the Company’s allocable share of any net taxable income from the LLC,
from certain state and local jurisdictions that impose taxes on partnerships, as well as earnings from our foreign
subsidiaries and C-Corporations subject to entity level taxation, and income tax expense recognized as a result of the
Common Control Reorganization (“CCR”) subsequent to the Velocity acquisition in the first quarter of 2025.
Non-Controlling Interests
Net income and Other comprehensive income (loss) are attributed to the non-controlling interests based on the
weighted-average LLC Common Units outstanding during the period and is presented on the Consolidated Statements of
Income. Refer to “Note 9, Stockholders’ Equity” of the audited consolidated financial statements in this Annual Report for
more information.
58
Results of Operations
Below is a summary table of the financial results and Non-GAAP measures that we find relevant to our
business operations:
Year Ended December 31, | ||||||
(in thousands, except percentages and per share data) | 2025 | 2024 | 2023 | |||
Revenue | ||||||
Net commissions and fees | $2,994,582 | $2,455,671 | $2,026,596 | |||
Fiduciary investment income | 56,544 | 60,039 | 50,953 | |||
Total revenue | $3,051,126 | $2,515,710 | $2,077,549 | |||
Expenses | ||||||
Compensation and benefits | 1,803,397 | 1,591,077 | 1,321,029 | |||
General and administrative | 453,452 | 352,050 | 276,181 | |||
Amortization | 274,426 | 157,845 | 106,799 | |||
Depreciation | 13,089 | 9,785 | 9,038 | |||
Change in contingent consideration | 13,122 | (22,859) | 5,421 | |||
Total operating expenses | $2,557,486 | $2,087,898 | $1,718,468 | |||
Operating income | $493,640 | $427,812 | $359,081 | |||
Interest expense, net | 222,384 | 158,448 | 119,507 | |||
Income from equity method investments | (21,236) | (18,231) | (8,731) | |||
Other non-operating loss (income) | (692) | 15,041 | 10,380 | |||
Income before income taxes | $293,184 | $272,554 | $237,925 | |||
Income tax expense | 79,027 | 42,641 | 43,445 | |||
Net income | $214,157 | $229,913 | $194,480 | |||
GAAP financial measures | ||||||
Revenue | $3,051,126 | $2,515,710 | $2,077,549 | |||
Net commissions and fees | 2,994,582 | 2,455,671 | 2,026,596 | |||
Compensation and benefits | 1,803,397 | 1,591,077 | 1,321,029 | |||
General and administrative | 453,452 | 352,050 | 276,181 | |||
Net income | 214,157 | 229,913 | 194,480 | |||
Compensation and benefits expense ratio (1) | 59.1% | 63.2% | 63.6% | |||
General and administrative expense ratio (2) | 14.9% | 14.0% | 13.3% | |||
Net income margin (3) | 7.0% | 9.1% | 9.4% | |||
Earnings per share (4) | $0.50 | $0.78 | $0.53 | |||
Diluted earnings per share (4) | $0.47 | $0.71 | $0.52 | |||
Non-GAAP financial measures* | ||||||
Organic revenue growth rate | 10.1% | 12.8% | 15.4% | |||
Adjusted compensation and benefits expense | $1,692,000 | $1,426,674 | $1,222,342 | |||
Adjusted compensation and benefits expense ratio | 55.5% | 56.7% | 58.8% | |||
Adjusted general and administrative expense | $392,384 | $277,813 | $230,467 | |||
Adjusted general and administrative expense ratio | 12.9% | 11.0% | 11.1% | |||
Adjusted EBITDAC | $966,742 | $811,223 | $624,740 | |||
Adjusted EBITDAC margin | 31.7% | 32.2% | 30.1% | |||
Adjusted net income | $548,219 | $493,521 | $375,582 | |||
Adjusted net income margin | 18.0% | 19.6% | 18.1% | |||
Adjusted diluted earnings per share | $1.96 | $1.79 | $1.38 | |||
(1)Compensation and benefits expense ratio is defined as Compensation and benefits expense divided by Total revenue.
(2)General and administrative expense ratio is defined as General and administrative expense divided by Total revenue.
59
(3)Net income margin is defined as Net income divided by Total revenue.
(4)See “Note 11, Earnings Per Share” in the footnotes to the consolidated financial statements in this Annual Report for
further discussion of how these metrics are calculated.
* These measures are Non-GAAP. Please refer to the section entitled “Non-GAAP Financial Measures and Key
Performance Indicators” below for definitions and reconciliations to the most directly comparable GAAP measure.
Comparison of the Years Ended December 31, 2025 and 2024
Revenue
Total Revenue
Total revenue increased by $535.4 million, or 21.3%, from $2,515.7 million to $3,051.1 million, for the year
ended December 31, 2025, as compared to the prior year. The following were the drivers of the increase:
•$245.4 million, or 9.8%, of the period-over-period change in Total revenue was due to acquisitions during
their first twelve months of ownership by the Company. Acquisition revenue was offset by a $1.6 million
decline in revenue period-over-period relating to the sale of a small non-subscription workers compensation
book of business at the end of 2024;
•$240.3 million, or 9.5%, of the period-over-period change in Total revenue was due to organic revenue
growth in Net commissions and fees. Organic revenue growth represents the change in Net commissions
and fees revenue, as compared to the same period for the year prior, adjusted for Net commissions and fees
attributable to recent acquisitions during the first twelve months of Ryan Specialty’s ownership, and other
adjustments such as the removal of the impact of contingent commissions and the impact of changes in
foreign exchange rates. In aggregate, our net commission rates were consistent period-over-period. Also,
we grew our client relationships, in aggregate, within each of our three Specialties. The growth of these
relationships is due to the combination of growth in specialty and E&S markets and winning new business
from competitors. We experienced growth across the majority of our casualty lines, offset by a moderate
pullback across our property portfolio. The moderate pullback across our property portfolio was driven by a
continued decline in rates and retailers realizing additional opportunities to place coverage directly. This
decline was partially offset by new business generation. Growth in the period was balanced across our three
Specialties, driven by an increase in the flow of risks into the specialty and E&S markets;
•$53.2 million, or 2.1%, of the period-over-period change in Total revenue was due to contingent
commissions and the impact of foreign exchange rates on the Company’s Net commissions and fees; and
•$3.5 million, or 0.1%, of the period-over-period change in Total revenue was due to a decrease in Fiduciary
investment income, caused by a decline in interest rates compared to the prior-year period.
Year Ended December 31, | Period over Period | |||||||||||
(in thousands, except percentages) | 2025 | % of total | 2024 | % of total | Change | |||||||
Wholesale Brokerage | $1,600,427 | 53.4% | $1,489,077 | 60.7% | $111,350 | 7.5% | ||||||
Binding Authority | 370,155 | 12.4 | 320,379 | 13.0 | 49,776 | 15.5 | ||||||
Underwriting Management | 1,024,000 | 34.2 | 646,215 | 26.3 | 377,785 | 58.5 | ||||||
Total Net commissions and fees | $2,994,582 | $2,455,671 | $538,911 | 21.9% | ||||||||
Wholesale Brokerage net commissions and fees increased by $111.4 million, or 7.5%, period-over-period,
primarily due to organic growth within the Specialty for the period as well as an increase in contingent commissions and
contributions from the JM Wilson acquisition.
Binding Authority net commissions and fees increased by $49.8 million, or 15.5%, period-over-period,
primarily due to strong organic growth within the Specialty for the period as well as an increase in contingent commissions
and contributions from the JM Wilson acquisition.
60
Underwriting Management net commissions and fees increased by $377.8 million, or 58.5%, period-over-
period, primarily due to organic growth within the Specialty for the period, inclusive of an increase in transactional
business, contributions from recent acquisitions, and an increase in contingent commissions.
The following table sets forth our revenue by type of commission and fees:
Year Ended December 31, | Period over Period | |||||||||||
(in thousands, except percentages) | 2025 | % of total | 2024 | % of total | Change | |||||||
Net commissions and policy fees | $2,759,597 | 92.1% | $2,310,384 | 94.1% | $449,213 | 19.4% | ||||||
Supplemental and contingent commissions | 149,237 | 5.0 | 88,842 | 3.6 | 60,395 | 68.0 | ||||||
Loss mitigation and other fees | 85,748 | 2.9 | 56,445 | 2.3 | 29,303 | 51.9 | ||||||
Total Net commissions and fees | $2,994,582 | $2,455,671 | $538,911 | 21.9% | ||||||||
Net commissions and policy fees grew $449.2 million, or 19.4%, period-over-period, slightly lower than the
overall net commissions and fee revenue growth of 21.9% for the year ended December 31, 2025, compared to the prior
year. The main drivers of this growth continue to be the acquisition of new business and expansion of ongoing client
relationships in response to the increasing demand for new E&S products as well as the inflow of risks from the Admitted
market into the specialty and E&S markets. In aggregate, we experienced stable commission rates period over period.
Supplemental and contingent commissions increased $60.4 million, or 68.0%, period-over-period, driven by the
performance of risks placed on eligible business earning profit-based or volume-based commissions as well as profit
commissions recognized from recent acquisitions.
Loss mitigation and other fees grew $29.3 million, or 51.9%, period-over-period, primarily due to increased
capital markets activity, captive management and other risk management services fees from the placement of alternative
risk insurance solutions, as well as contributions from recent acquisitions.
Expenses
Compensation and Benefits
Compensation and benefits expense increased by $212.3 million, or 13.3%, from $1,591.1 million to
$1,803.4 million for the year ended December 31, 2025, compared to the prior year. The following were the drivers of this
increase:
•An increase of $196.0 million was driven by (i) the addition of 815 employees during the period, inclusive
of acquired employees, and (ii) growth in the business. Overall headcount increased to 6,110 full-time
employees as of December 31, 2025, from 5,295 as of December 31, 2024;
•Commissions increased $68.5 million, or 9.6%, period-over-period, driven by the 7.5% increase in
Wholesale Brokerage and 15.5% increase in Binding Authority Net commissions and fees discussed above;
and
•An increase of $1.6 million was driven by Acquisition related long-term incentive compensation expense
associated with recent acquisitions.
•The increases were partially offset by a $39.9 million decline in Restructuring and related expense due to
the completion of the ACCELERATE 2025 program at the end of 2024;
•A decrease of $9.6 million in Equity-based compensation and Initial public offering related expense
associated with the reversal of certain executive performance-based awards’ expense in the period as well
as the natural runoff of Initial public offering related expense as awards continue to vest; and
•A decrease of $4.3 million was driven by Acquisition-related expense associated with recent acquisitions.
61
The net impact of revenue growth and the factors above resulted in a Compensation and benefits expense ratio
decrease of 4.1% from 63.2% to 59.1% period-over-period.
In general, we expect to continue experiencing a rise in commissions, salaries, incentives, and benefits expense
commensurate with our expected growth in business volume, revenue, and headcount.
General and Administrative
General and administrative expense increased by $101.4 million, or 28.8%, from $352.1 million to
$453.5 million for the year ended December 31, 2025, as compared to 2024. The following were the drivers of this
increase:
•$78.6 million of increased professional services and IT charges associated with ongoing technology and
data initiatives, costs directly linked to organic and inorganic revenue growth in the period, and recruiter
fees;
•$36.0 million was driven by growth in the business. Such expenses incurred to accommodate both organic
and inorganic revenue growth include travel and entertainment, occupancy, insurance, and foreign
exchange; and
•$6.6 million was driven by an increase in Acquisition-related expense associated with one-time diligence,
transaction-related, and integration costs.
•The increase was partially offset by a $19.8 million decline in Restructuring and related expense due to the
completion of the ACCELERATE 2025 program at the end of 2024.
The net impact of revenue growth and the factors listed above resulted in a General and administrative expense ratio
increase of 0.9% from 14.0% to 14.9% period-over-period.
Amortization
Amortization expense increased by $116.6 million, or 73.9%, from $157.8 million to $274.4 million for the
year ended December 31, 2025, compared to the prior year. The main driver of the increase was the amortization of
intangible assets from recent acquisitions. Our Customer relationships and Other intangible assets increased by
$140.8 million when comparing the balance as of December 31, 2025, to the balance as of December 31, 2024, due to
acquisition activity during the year.
Interest Expense, Net
Interest expense, net increased $63.9 million, or 40.4%, from $158.4 million to $222.4 million for the year
ended December 31, 2025, compared to the prior year. The main driver of the increase in Interest expense, net for the year
ended December 31, 2025, was an increase in debt from recent acquisition activity.
Other Non-Operating Loss (Income)
Other non-operating loss (income) increased by $15.7 million from $15.0 million of a loss in the prior year to
income of $0.7 million for the year ended December 31, 2025. For the year ended December 31, 2025, Other non-operating
loss (income) consisted of $0.6 million of seller reimbursement of acquisition-related retention incentives, $0.6 million of
sublease income, and $0.4 million of forfeitures of vested equity awards offset by $1.1 million of TRA contractual interest
and related charges. For the year ended December 31, 2024, Other non-operating loss consisted of $18.1 million of expense
related to Term Loan modifications and $1.3 million of TRA contractual interest and related charges offset by $3.4 million
of income related to a decrease in our blended state tax rates and foreign tax credit impact on the TRA remeasurement and
$0.5 million of sublease income.
Income Before Income Taxes
Due to the factors above, Income before income taxes increased $20.6 million, or 7.6%, from $272.6 million to
$293.2 million for the year ended December 31, 2025, compared to the prior year.
62
Income Tax Expense
Income tax expense increased $36.4 million from $42.6 million to $79.0 million for the year ended
December 31, 2025, as compared to the prior year primarily as a result of the $39.1 million increase in Deferred income tax
expense recognized as a result of the CCR subsequent to the Velocity acquisition in the first quarter of 2025 as compared to
the Deferred income tax expense recognized as a result of the CCR subsequent to the Innovisk acquisition in the fourth
quarter of 2024. The CCRs were one-time, non-cash income tax expenses incurred at Ryan Specialty Holdings, Inc., and
our federal and state tax rate, net of federal benefit, is unaffected.
Net Income
Net income decreased $15.8 million, or 6.9%, from $229.9 million to $214.2 million for the year ended
December 31, 2025, compared to the prior year as a result of the factors described above.
Comparison of the Years Ended December 31, 2024 and 2023
Revenue
Total Revenue
Total revenue increased by $438.2 million, or 21.1%, from $2,077.5 million to $2,515.7 million, for the year
ended December 31, 2024, as compared to the prior year. The following were the drivers of the increase:
•$252.2 million, or 12.1%, of the period-over-period change in Total revenue was due to organic revenue
growth in Net commissions and fees. Organic revenue growth represents the change in Net commissions
and fees revenue, as compared to the same period for the year prior, adjusted for Net commissions and fees
attributable to recent acquisitions during the first twelve months of Ryan Specialty’s ownership, and other
adjustments such as the removal of the impact of contingent commissions and the impact of changes in
foreign exchange rates. In aggregate, our net commission rates were consistent period-over-period. Also,
we grew our client relationships, in aggregate, within each of our three Specialties. The growth of these
relationships is due to the combination of a growing specialty and E&S markets and winning new business
from competitors. Growth for the year was balanced across our property and casualty portfolios within our
three Specialties, driven by an increase in the flow of risks into the specialty and E&S markets. This growth
was partially offset by a number of factors, none of which were individually significant such as (i) a
continued decline throughout the year in Net commissions and fees generated from the placement of public
company D&O insurance policies, related to a slow-down in IPO activity and an associated rapid premium
rate decrease and (ii) in the second half of 2024 a shift in property trends as capacity become more readily
available, which resulted in a decline in property premium rates. We believe these factors have also created
opportunities for retailers to place some of these property risk coverages directly;
•$142.0 million, or 6.8%, of the period-over-period change in Total revenue was due to the 2023 and 2024
acquisitions related to our first twelve months of ownership;
•$34.9 million, or 1.7%, of the period-over-period change in Net commissions and fees was due to changes
in contingent commissions and the impact of foreign exchange rates on our Net commissions and fees; and
•$9.1 million, or 0.5%, of the period-over-period change in Total revenue was due to an increase in
Fiduciary investment income, caused by a rise in fiduciary cash balances compared to the prior year.
Year Ended December 31, | Period over Period | |||||||||||
(in thousands, except percentages) | 2024 | % of total | 2023 | % of total | Change | |||||||
Wholesale Brokerage | $1,489,077 | 60.7% | $1,319,056 | 65.1% | $170,021 | 12.9% | ||||||
Binding Authority | 320,379 | 13.0 | 275,961 | 13.6 | 44,418 | 16.1 | ||||||
Underwriting Management | 646,215 | 26.3 | 431,579 | 21.3 | 214,636 | 49.7 | ||||||
Total Net commissions and fees | $2,455,671 | $2,026,596 | $429,075 | 21.2% | ||||||||
Wholesale Brokerage net commissions and fees increased by $170.0 million, or 12.9%, period-over-period,
primarily due to strong organic growth within the Specialty.
63
Binding Authority net commissions and fees increased by $44.4 million, or 16.1%, period-over-period,
primarily due to strong organic growth within the Specialty.
Underwriting Management net commissions and fees increased by $214.6 million, or 49.7%, period-over-
period, primarily due to strong organic growth within the Specialty as well as contributions from the AccuRisk, Castel, US
Assure, Greenhill, Ethos P&C, EverSports, Geo, and Innovisk acquisitions.
The following table sets forth our revenue by type of commission and fees:
Year Ended December 31, | Period over Period | |||||||||||
(in thousands, except percentages) | 2024 | % of total | 2023 | % of total | Change | |||||||
Net commissions and policy fees | $2,310,384 | 94.1% | $1,935,851 | 95.5% | $374,533 | 19.3% | ||||||
Supplemental and contingent commissions | 88,842 | 3.6 | 56,375 | 2.8 | 32,467 | 57.6 | ||||||
Loss mitigation and other fees | 56,445 | 2.3 | 34,370 | 1.7 | 22,075 | 64.2 | ||||||
Total Net commissions and fees | $2,455,671 | $2,026,596 | $429,075 | 21.2% | ||||||||
Net commissions and policy fees grew $374.5 million, or 19.3%, period-over-period, slightly lower than the
overall net commissions and fee revenue growth of 21.2% for the year ended December 31, 2024, compared to the prior
year. The main drivers of this growth continue to be the acquisition of new business and expansion of ongoing client
relationships in response to the increasing demand for new E&S products as well as the inflow of risks from the Admitted
market into the specialty and E&S markets. In aggregate, we experienced stable commission rates period over period.
Supplemental and contingent commissions increased $32.5 million, or 57.6%, period-over-period, driven by the
performance of risks placed on eligible business earning profit-based or volume-based commissions as well as profit
commissions recognized from acquisitions completed in 2024.
Loss mitigation and other fees grew $22.1 million, or 64.2%, period-over-period, primarily due to increased
capital markets activity, additional captive management and other risk management services fees from the placement of
alternative risk insurance solutions as well as growth in certain fees related to the ACE, Point6, and AccuRisk acquisitions
completed in the second half of 2023.
Expenses
Compensation and Benefits
Compensation and benefits expense increased by $270.0 million, or 20.4%, from $1,321.0 million to $1,591.1
million for the year ended December 31, 2024, compared to the prior year. The following were the drivers of this increase:
•Commissions increased $91.1 million, or 14.7%, period-over-period, driven by the 21.2% increase in total
Net commissions and fees discussed above;
•An increase of $29.3 million was driven by Acquisition related long-term incentive compensation expense
associated with recent acquisitions;
•An increase of $17.3 million was driven by Restructuring and related expense associated with the
ACCELERATE 2025 program;
•An increase of $11.2 million was driven by Acquisition-related expense associated with recent acquisitions;
•A net increase of $9.3 million was driven by equity-based compensation, caused by an increase of $21.0
million in normal course equity-based compensation expense offset by a decrease of $11.7 million of IPO
related expenses; and
•An increase of $111.8 million was driven by (i) the addition of 938 employees compared to the prior year,
inclusive of acquired employees, and (ii) growth in the business. Overall headcount increased to 5,295 full-
time employees as of December 31, 2024, from 4,357 as of December 31, 2023.
64
The net impact of revenue growth and the factors above resulted in a Compensation and benefits expense ratio
decrease of 0.4% from 63.6% to 63.2% period-over-period.
In general, we expect to continue experiencing a rise in commissions, salaries, incentives, and benefits expense
commensurate with our expected growth in business volume, revenue, and headcount.
General and Administrative
General and administrative expense increased by $75.9 million, or 27.5%, from $276.2 million to $352.1
million for the year ended December 31, 2024, as compared to 2023. The following were the drivers of this increase:
•$47.4 million was driven by growth in the business. Expenses incurred to accommodate both organic and
inorganic revenue growth include IT, travel and entertainment, occupancy, and insurance;
•$35.4 million of increased Acquisition-related expense associated with recent and prospective acquisitions;
and
•These increases were partially offset by a $6.9 million decrease compared to the prior year in Restructuring
and related expense associated with the ACCELERATE 2025 program.
The net impact of revenue growth and the factors listed above resulted in a General and administrative expense ratio
increase of 0.7% from 13.3% to 14.0% period-over-period.
Amortization
Amortization expense increased by $51.0 million, or 47.8%, from $106.8 million to $157.8 million for the year
ended December 31, 2024, compared to the prior year. The main driver of the increase was the amortization of intangible
assets from recent acquisitions. Our Customer relationships and Other intangible assets increased by $865.1 million when
comparing the balance as of December 31, 2024, to the balance as of December 31, 2023, with the largest individual
increase generated by the US Assure acquisition.
Interest Expense, Net
Interest expense, net increased $38.9 million, or 32.6%, from $119.5 million to $158.4 million for the year
ended December 31, 2024, compared to the prior year. The main driver of the increase in Interest expense, net for the year
ended December 31, 2024, was an increase in debt from recent acquisition activity. For the years ended December 31, 2024
and 2023, the reduction to Interest expense, net related to our interest rate cap was $17.8 million and $15.9 million,
respectively. Interest earned on the Company’s Cash and cash equivalents balances offsets Interest expense, net. For the
years ended December 31, 2024 and 2023, the Company earned interest income of $21.5 million and $32.0 million,
respectively.
Other Non-Operating Loss
Other non-operating loss increased by $4.6 million from $10.4 million in the prior year to $15.0 million for the
year ended December 31, 2024. For the year ended December 31, 2024, Other non-operating loss consisted of $18.1
million of expense related to Term Loan modifications and $1.3 million of TRA contractual interest and related charges
offset by $3.4 million of income related to a decrease in our blended state tax rates and foreign tax credit impact on the
TRA remeasurement and $0.5 million of sublease income. For the year ended December 31, 2023, Other non-operating
loss included a $10.4 million charge related to the change in the TRA liability caused by a change in our blended state tax
rates.
Income Before Income Taxes
Due to the factors above, Income before income taxes increased $34.6 million, or 14.6%, from $237.9 million
to $272.6 million for the year ended December 31, 2024, compared to the prior year.
Income Tax Expense
Income tax expense decreased $0.8 million from $43.4 million to $42.6 million for the year ended December
31, 2024, as compared to the prior year primarily due to a $13.9 million deferred tax benefit in 2024 from equity-based
compensation and a $8.8 million decrease in Deferred income tax expense recognized as a result of the CCR subsequent to
the Socius and AccuRisk acquisitions in the second half of 2023 and Innovisk in the fourth quarter of 2024. These CCRs
65
were discrete, non-cash expenses incurred at Ryan Specialty Holdings, Inc., and the Company’s annual effective tax rate is
unaffected. The decrease was partially offset by an increase in pre-tax book income allocated to the Company for the year
ended December 31, 2024, and a decrease in the Company’s blended state tax rate during 2024 which resulted in increased
tax expense recognized related to the change in our Deferred tax assets.
Net Income
Net income increased $35.4 million, or 18.2%, from $194.5 million to $229.9 million for the year ended
December 31, 2024, compared to the prior year as a result of the factors described above.
Non-GAAP Financial Measures and Key Performance Indicators
In assessing the performance of our business, we use non-GAAP financial measures that are derived from our
consolidated financial information, but which are not presented in our consolidated financial statements prepared in
accordance with GAAP. We consider these non-GAAP financial measures to be useful metrics for management and
investors to facilitate operating performance comparisons from period to period by excluding potential differences caused
by variations in capital structures, tax positions, depreciation, amortization, and certain other items that we believe are not
representative of our core business. We use the following non-GAAP measures for business planning purposes, in
measuring our performance relative to that of our competitors, to help investors to understand the nature of our growth, and
to enable investors to evaluate the run-rate performance of the Company. Non-GAAP financial measures should be viewed
as supplementing, and not as an alternative or substitute for, the consolidated financial statements prepared and presented
in accordance with GAAP. The footnotes to the reconciliation tables below should be read in conjunction with the audited
consolidated financial statements in this Annual Report. Industry peers may provide similar supplemental information but
may not define similarly named metrics in the same way we do and may not make identical adjustments.
Organic Revenue Growth Rate
Organic Revenue Growth Rate is defined as the percentage change in Net commissions and fees, as compared
to the same period for the prior year, adjusted to eliminate revenue attributable to acquisitions for the first twelve months of
ownership, revenue attributable to sold businesses for the subsequent twelve months after a sale, and other items such as
contingent commissions and the impact of changes in foreign exchange rates.
66
For the avoidance of doubt, prior period references in the tables below represent the same period in the prior
year. A reconciliation of Organic revenue growth rate to Net commissions and fees growth rate, the most directly
comparable GAAP measure, for each of the periods indicated is as follows (in percentages):
Year Ended December 31, | ||||||
(in thousands, except percentages) | 2025 | 2024 | 2023 | |||
Current period Net commissions and fees revenue | $2,994,582 | $2,455,671 | $2,026,596 | |||
Less: Current period contingent commissions | (121,549) | (73,175) | (39,028) | |||
Less: Revenue attributable to sold businesses | (361) | — | — | |||
Net commissions and fees revenue excluding contingent commissions | $2,872,672 | $2,382,496 | $1,987,568 | |||
Prior period Net commissions and fees revenue | $2,455,671 | $2,026,596 | $1,711,861 | |||
Less: Prior period contingent commissions | (73,175) | (39,028) | (30,788) | |||
Less: Revenue attributable to sold businesses | (1,941) | — | — | |||
Prior period Net commissions and fees revenue excluding contingent commissions | $2,380,555 | $1,987,568 | $1,681,073 | |||
Change in Net commissions and fees revenue excluding contingent commissions | $492,117 | $394,928 | $306,494 | |||
Less: Mergers and acquisitions Net commissions and fees revenue excluding contingent commissions | (246,914) | (141,972) | (46,496) | |||
Impact of change in foreign exchange rates | (4,863) | (791) | (479) | |||
Organic revenue growth (Non-GAAP) | $240,340 | $252,165 | $259,519 | |||
Net commissions and fees revenue growth rate (GAAP) | 21.9 % | 21.2 % | 18.4 % | |||
Less: Impact of contingent commissions (1) | (1.2) | (1.3) | (0.2) | |||
Net commissions and fees revenue excluding contingent commissions growth rate (2) | 20.7 % | 19.9 % | 18.2 % | |||
Less: Mergers and acquisitions Net commissions and fees revenue excluding contingent commissions (3) | (10.4) | (7.1) | (2.8) | |||
Impact of change in foreign exchange rates (4) | (0.2) | 0.0 | 0.0 | |||
Organic Revenue Growth Rate (Non-GAAP) | 10.1 % | 12.8 % | 15.4 % | |||
(1)Calculated by subtracting Net commissions and fees revenue growth rate from net commissions and fees revenue
excluding contingent commissions growth rate and revenue from sold businesses.
(2)Calculated by dividing the change in Total net commissions & fees revenue excluding contingent commissions by
prior year net commissions and fees excluding contingent commissions.
(3)Calculated by taking the mergers and acquisitions net commissions and fees revenue excluding contingent
commissions, representing the first 12 months of net commissions and fees revenue generated from acquisitions,
divided by prior period net commissions and fees revenue excluding contingent commissions.
(4)Calculated by taking the change in foreign exchange rates divided by prior period net commissions and fees revenue
excluding contingent commissions.
Adjusted Compensation and Benefits Expense and Adjusted Compensation and Benefits Expense Ratio
We define Adjusted compensation and benefits expense as Compensation and benefits expense adjusted to
reflect items such as (i) equity-based compensation, (ii) acquisition and restructuring related compensation expense, and
(iii) other exceptional or non-recurring items, as applicable. The most comparable GAAP financial metric is Compensation
and benefits expense. Adjusted compensation and benefits expense ratio is defined as Adjusted compensation and benefits
67
expense as a percentage of Total revenue. The most comparable GAAP financial metric is Compensation and benefits
expense ratio.
A reconciliation of Adjusted compensation and benefits expense and Adjusted compensation and benefits
expense ratio to Compensation and benefits expense and Compensation and benefits expense ratio, the most directly
comparable GAAP measures, for each of the periods indicated, is as follows:
Year Ended December 31, | ||||||
(in thousands, except percentages) | 2025 | 2024 | 2023 | |||
Total Revenue | $3,051,126 | $2,515,710 | $2,077,549 | |||
Compensation and Benefits Expense | $1,803,397 | $1,591,077 | $1,321,029 | |||
Acquisition-related expense | (11,033) | (15,373) | (4,186) | |||
Acquisition related long-term incentive compensation (1) | (26,581) | (24,946) | 4,334 | |||
Restructuring and related expense | — | (39,929) | (22,651) | |||
Amortization and expense related to discontinued prepaid incentives | (4,332) | (5,160) | (6,441) | |||
Equity-based compensation (2) | (49,664) | (52,038) | (31,047) | |||
IPO related expenses | (19,787) | (26,957) | (38,696) | |||
Adjusted Compensation and Benefits Expense (3) | $1,692,000 | $1,426,674 | $1,222,342 | |||
Compensation and Benefits Expense Ratio | 59.1% | 63.2% | 63.6% | |||
Adjusted Compensation and Benefits Expense Ratio | 55.5% | 56.7% | 58.8% | |||
(1)In 2023, Acquisition related long-term incentive compensation includes a $6.8 million expense reversal related to the
clawback of an All Risks LTIP payment from a terminated employee.
(2)In 2025, Equity-based compensation expense included $5.8 million of expense reversal associated with certain
executive performance-based awards on account of it becoming unlikely the performance targets would be achieved.
In 2024, Equity-based compensation included $4.6 million of expense associated with the removal of equity transfer
restrictions for an executive officer of the Company. See “Note 10, Equity-Based Compensation” of the audited
financial statements in this Annual Report for additional discussion on equity-based compensation.
(3)Adjustments to Compensation and benefits expense are described in the definition of Adjusted EBITDAC to Net
income in “Adjusted EBITDAC and Adjusted EBITDAC Margin”.
Adjusted General and Administrative Expense and Adjusted General and Administrative Expense Ratio
We define Adjusted general and administrative expense as General and administrative expense adjusted to
reflect items such as (i) acquisition and restructuring general and administrative related expense and (ii) other exceptional
or non-recurring items, as applicable. The most comparable GAAP financial metric is General and administrative expense.
Adjusted general and administrative expense ratio is defined as Adjusted general and administrative expense as a
percentage of Total revenue. The most comparable GAAP financial metric is General and administrative expense ratio.
68
A reconciliation of Adjusted general and administrative expense and Adjusted general and administrative
expense ratio to General and administrative expense and General and administrative expense ratio, the most directly
comparable GAAP measures, for each of the periods indicated is as follows:
Year Ended December 31, | ||||||
(in thousands, except percentages) | 2025 | 2024 | 2023 | |||
Total Revenue | $3,051,126 | $2,515,710 | $2,077,549 | |||
General and Administrative Expense | $453,452 | $352,050 | $276,181 | |||
Acquisition-related expense | (61,068) | (54,469) | (19,088) | |||
Restructuring and related expense | — | (19,768) | (26,626) | |||
Adjusted General and Administrative Expense (1) | $392,384 | $277,813 | $230,467 | |||
General and Administrative Expense Ratio | 14.9% | 14.0% | 13.3% | |||
Adjusted General and Administrative Expense Ratio | 12.9% | 11.0% | 11.1% | |||
(1)Adjustments to General and administrative expense are described in the definition of Adjusted EBITDAC to Net
income in “Adjusted EBITDAC and Adjusted EBITDAC Margin”.
Adjusted EBITDAC and Adjusted EBITDAC Margin
We define Adjusted EBITDAC as Net income before Interest expense, net, Income tax expense, Depreciation,
Amortization, and Change in contingent consideration, adjusted to reflect items such as (i) equity-based compensation, (ii)
acquisition and restructuring related expenses, and (iii) other exceptional or non-recurring items, as applicable.
Acquisition-related expense includes one-time diligence, transaction-related, and integration costs. For the year
ended December 31, 2024, Acquisition-related expense included a $4.5 million charge related to a deal-contingent foreign
exchange forward contract associated with the Castel acquisition. The remaining charges in the three years presented
represent typical one-time diligence, transaction-related, and integration costs. Acquisition-related long-term incentive
compensation arises from long-term incentive plans associated with acquisitions. These plans require service requirements,
and in some cases performance targets, to be achieved in order to be earned. Restructuring and related expense for the years
ended December 31, 2024 and 2023, consisted of compensation and benefits, occupancy, contractors, professional services,
and license fees related to the ACCELERATE 2025 program, which concluded at the end of 2024. The compensation and
benefits expense included severance as well as employment costs related to services rendered between the notification and
termination dates and other termination payments. Amortization and expense is composed of charges related to
discontinued prepaid incentive programs. For the year ended December 31, 2025, Other non-operating loss (income)
consisted of $0.6 million of seller reimbursement of acquisition-related retention incentives, $0.6 million of sublease
income, and $0.4 million of forfeitures of vested equity awards offset by $1.1 million of TRA contractual interest and
related charges. For the year ended December 31, 2024, Other non-operating loss (income) consisted of $18.1 million of
expense related to Term Loan modifications and $1.3 million of TRA contractual interest and related charges offset by $3.4
million of income related to a decrease in our blended state tax rates and foreign tax credit impact on the TRA
remeasurement and $0.5 million of sublease income. For the year ended December 31, 2023, Other non-operating loss
(income) included a $10.4 million charge related to the change in the TRA liability caused by a change in our blended state
tax rates. Equity-based compensation reflects non-cash equity-based expense. IPO related expenses include compensation-
related expense primarily related to the expense for new awards issued at IPO as well as expense related to the revaluation
of existing equity awards at IPO.
Total revenue less Adjusted compensation and benefits expense and Adjusted general and administrative
expense is equivalent to Adjusted EBITDAC. For a breakout of compensation and general and administrative costs for each
addback, refer to the Adjusted compensation and benefits expense and Adjusted general and administrative expense tables
above. The most directly comparable GAAP financial metric to Adjusted EBITDAC is Net income. Adjusted EBITDAC
margin is defined as Adjusted EBITDAC as a percentage of Total revenue. The most comparable GAAP financial metric is
Net income margin.
69
A reconciliation of Adjusted EBITDAC and Adjusted EBITDAC margin to Net income and Net income
margin, the most directly comparable GAAP measures, for each of the periods indicated is as follows:
Year Ended December 31, | ||||||
(in thousands, except percentages) | 2025 | 2024 | 2023 | |||
Total Revenue | $3,051,126 | $2,515,710 | $2,077,549 | |||
Net Income | $214,157 | $229,913 | $194,480 | |||
Interest expense, net | 222,384 | 158,448 | 119,507 | |||
Income tax expense | 79,027 | 42,641 | 43,445 | |||
Depreciation | 13,089 | 9,785 | 9,038 | |||
Amortization | 274,426 | 157,845 | 106,799 | |||
Change in contingent consideration (1) | 13,122 | (22,859) | 5,421 | |||
EBITDAC | $816,205 | $575,773 | $478,690 | |||
Acquisition-related expense | 72,101 | 69,842 | 23,274 | |||
Acquisition related long-term incentive compensation (2) | 26,581 | 24,946 | (4,334) | |||
Restructuring and related expense | — | 59,697 | 49,277 | |||
Amortization and expense related to discontinued prepaid incentives | 4,332 | 5,160 | 6,441 | |||
Other non-operating loss (income) | (692) | 15,041 | 10,380 | |||
Equity-based compensation | 49,664 | 52,038 | 31,047 | |||
IPO related expenses | 19,787 | 26,957 | 38,696 | |||
Income from equity method investments | (21,236) | (18,231) | (8,731) | |||
Adjusted EBITDAC | $966,742 | $811,223 | $624,740 | |||
Net Income Margin | 7.0% | 9.1% | 9.4% | |||
Adjusted EBITDAC Margin | 31.7% | 32.2% | 30.1% | |||
(1)For the year ended December 31, 2024, Change in contingent consideration included a $25.5 million decrease in
valuation of the US Assure contingent consideration as a result of increased loss ratios impacting projected profit
commissions.
(2)For the year ended December 31, 2023, Acquisition related long-term incentive compensation includes a $6.8 million
expense reversal related to the clawback of an All Risks LTIP payment from a terminated employee.
Adjusted Net Income and Adjusted Net Income Margin
We define Adjusted net income as tax-effected earnings before amortization and certain items of income and
expense, gains and losses, equity-based compensation, acquisition related long-term incentive compensation, acquisition-
related expenses, costs associated with the IPO, and certain exceptional or non-recurring items. The most comparable
GAAP financial metric is Net income. Adjusted net income margin is calculated as Adjusted net income as a percentage of
Total revenue. The most comparable GAAP financial metric is Net income margin.
Following the IPO, the Company is subject to United States federal income taxes, in addition to state, local, and
foreign taxes, with respect to our allocable share of any net taxable income of the LLC. For comparability purposes, this
calculation incorporates the impact of federal and state statutory tax rates on 100% of our adjusted pre-tax income as if the
Company owned 100% of the LLC.
70
A reconciliation of Adjusted net income and Adjusted net income margin to Net income and Net income
margin, the most directly comparable GAAP measures, for each of the periods indicated is as follows:
Year Ended December 31, | ||||||
(in thousands, except percentages) | 2025 | 2024 | 2023 | |||
Total Revenue | $3,051,126 | $2,515,710 | $2,077,549 | |||
Net Income | $214,157 | $229,913 | $194,480 | |||
Income tax expense | 79,027 | 42,641 | 43,445 | |||
Amortization | 274,426 | 157,845 | 106,799 | |||
Amortization of deferred debt issuance costs (1) | 9,567 | 23,930 | 12,172 | |||
Change in contingent consideration | 13,122 | (22,859) | 5,421 | |||
Acquisition-related expense | 72,101 | 69,842 | 23,274 | |||
Acquisition related long-term incentive compensation | 26,581 | 24,946 | (4,334) | |||
Restructuring and related expense | — | 59,697 | 49,277 | |||
Amortization and expense related to discontinued prepaid incentives | 4,332 | 5,160 | 6,441 | |||
Other non-operating loss (income) | (692) | 15,041 | 10,380 | |||
Equity-based compensation | 49,664 | 52,038 | 31,047 | |||
IPO related expenses | 19,787 | 26,957 | 38,696 | |||
Income from equity method investments | (21,236) | (18,231) | (8,731) | |||
Adjusted Income before Income Taxes (2) | $740,836 | $666,920 | $508,367 | |||
Adjusted tax expense (3) | (192,617) | (173,399) | (132,785) | |||
Adjusted Net Income | $548,219 | $493,521 | $375,582 | |||
Net Income Margin | 7.0% | 9.1% | 9.4% | |||
Adjusted Net Income Margin | 18.0% | 19.6% | 18.1% | |||
(1)Interest expense, net includes amortization of deferred debt issuance costs.
(2)Adjustments to Net income are described in the definition of Adjusted EBITDAC to Net income in “Adjusted
EBITDAC and Adjusted EBITDAC Margin.”
(3)The Company is subject to United States federal income taxes, in addition to state, local, and foreign taxes, with
respect to our allocable share of any net taxable income of the LLC. For the years ended December 31, 2025 and 2024,
this calculation of adjusted tax expense is based on a federal statutory rate of 21% and a combined state income tax
rate net of federal benefits of 5.00% on 100% of our adjusted income before income taxes as if the Company owned
100% of the LLC. For the year ended December 31, 2023, this calculation of adjusted tax expense is based on a federal
statutory rate of 21% and a combined state income tax rate net of federal benefits of 5.12% on 100% of our adjusted
income before income taxes as if the Company owned 100% of the LLC.
Adjusted Diluted Earnings Per Share
We define Adjusted diluted earnings per share as Adjusted net income divided by diluted shares outstanding
after adjusting for the effect if 100% of the outstanding LLC Common Units (together with the shares of Class B common
stock), vested Class C Incentive Units, vested but unexercised Options, and unvested equity awards were exchanged into
shares of Class A common stock as if 100% of unvested equity awards were vested. The most directly comparable GAAP
financial metric is Diluted earnings per share.
71
A reconciliation of Adjusted diluted earnings per share to Diluted earnings per share, the most directly
comparable GAAP measure, for each of the periods indicated is as follows:
Year Ended December 31, | ||||||
2025 | 2024 | 2023 | ||||
Earnings per share of Class A common stock – diluted | $0.47 | $0.71 | $0.52 | |||
Less: Net income attributed to dilutive shares and substantively vested RSUs (1) | (0.01) | — | (0.03) | |||
Plus: Impact of all LLC Common Units exchanged for Class A shares (2) | 0.32 | 0.14 | 0.24 | |||
Plus: Adjustments to Adjusted net income (3) | 1.22 | 0.97 | 0.67 | |||
Plus: Dilutive impact of unvested equity awards (4) | (0.04) | (0.03) | (0.02) | |||
Adjusted diluted earnings per share | $1.96 | $1.79 | $1.38 | |||
(Share count in ’000s) | ||||||
Weighted-average shares of Class A common stock outstanding – diluted | 138,246 | 132,891 | 125,745 | |||
Plus: Impact of all LLC Common Units exchanged for Class A shares (2) | 135,429 | 138,980 | 142,384 | |||
Plus: Dilutive impact of unvested equity awards (4) | 5,354 | 4,417 | 4,137 | |||
Adjusted diluted earnings per share diluted share count | 279,029 | 276,288 | 272,266 | |||
(1)Adjustment removes the impact of Net income attributed to dilutive awards and substantively vested RSUs to arrive at
Net income attributable to Ryan Specialty Holdings, Inc. For the years ended December 31, 2025, 2024, and 2023, this
removes $0.9 million, $0.3 million, and $4.2 million of Net income, respectively, on 138.2 million, 132.9 million, and
125.7 million Weighted-average shares of Class A common stock outstanding - diluted, respectively. See “Note 11,
Earnings Per Share” in the footnotes to the consolidated financial statements in this Annual Report.
(2)For comparability purposes, this calculation incorporates the Net income that would be outstanding if all LLC
Common Units (together with shares of Class B common stock) were exchanged for shares of Class A common stock.
For the years ended December 31, 2025, 2024, and 2023, this includes $150.8 million, $135.2 million, and
$133.4 million of Net income, respectively, on 273.7 million, 271.9 million, and 268.1 million Weighted-average
shares of Class A common stock outstanding - diluted, respectively. See “Note 11, Earnings Per Share” in the
footnotes to the consolidated financial statements in this Annual Report.
(3)Adjustments to Adjusted net income are described in the footnotes of the reconciliation of Adjusted net income to Net
income in “Adjusted Net Income and Adjusted Net Income Margin” on 273.7 million, 271.9 million, and 268.1 million
Weighted-average shares of Class A common stock outstanding - diluted years ended December 31, 2025, 2024, and
2023, respectively.
(4)For comparability purposes and to be consistent with the treatment of the adjustments to arrive at Adjusted net income,
the dilutive effect of unvested equity awards as well as outstanding vested options and Class C Incentive Units is
calculated using the treasury stock method as if the weighted-average unrecognized cost associated with the awards
was $0 over the period, less any unvested equity awards determined to be dilutive within the Diluted EPS calculation
disclosed in “Note 11, Earnings Per Share” of the audited consolidated financial statements. For the years ended
December 31, 2025, 2024, and 2023, 5.4 million, 4.4 million, and 4.1 million shares were added to the calculation,
respectively.
Liquidity and Capital Resources
Liquidity describes the ability of a company to generate sufficient cash flows to meet the cash requirements of
its business operations. We believe that the balance sheet and strong cash flow profile of our business provides adequate
liquidity. The primary sources of liquidity are Cash and cash equivalents on the Consolidated Balance Sheets, cash flows
provided by operations, and debt capacity available under our Revolving Credit Facility, Term Loan, and Senior Secured
Notes. The primary uses of liquidity are operating expenses, seasonal working capital needs, business combinations, capital
expenditures, obligations under the TRA, taxes, distributions to LLC Unitholders, share repurchases, and dividends to
72
Class A common stockholders. We believe that Cash and cash equivalents, cash flows from operations, and amounts
available under our Revolving Credit Facility will be sufficient to meet liquidity needs, including principal and interest
payments on debt obligations, capital expenditures, and anticipated working capital requirements, for the next 12 months
and beyond. Our future capital requirements will depend on many factors including continuance of historical working
capital levels and capital expenditure needs, investment in de novo offerings, and the flow of deals in our merger and
acquisition program.
On February 12, 2026, our Board declared and increased the Company’s regular quarterly dividend by 8.3% to
$0.13 per share on the outstanding Class A common stock. With respect to this regular quarterly dividend, $0.07 of the
regular quarterly dividend is to be funded by current and prior tax distributions from the LLC that are in excess of both the
corporate income taxes payable by the Company as well as the Company’s obligations pursuant to the Tax Receivable
Agreement. The remaining $0.06 of the regular quarterly dividend is to be funded by free cash flow from the LLC and paid
to all holders of the Class A common stock and LLC Common Units.
On February 12, 2026, our Board approved a share repurchase program that authorizes the Company to
repurchase up to $300 million of its outstanding Class A common stock. Share repurchases may be made from time to time
on the open market, in privately negotiated transactions, using Rule 10b5-1 trading plans, as accelerated share repurchases,
or in any other manner that complies with the applicable securities law. The timing of purchases and number of shares
repurchased under the program will depend upon a variety of factors including the Company’s stock price, trading volume,
working capital or other liquidity requirements, and market conditions. The Company is not obligated to purchase any
shares under the program and the program may be suspended or discontinued at any time without notice.
We may be required to seek additional equity or debt financing. In the event that additional financing is
required from outside sources, we may not be able to raise it on terms acceptable to us or at all. If we are unable to raise
additional capital or generate cash flows necessary to expand our operations, this could reduce our ability to compete
successfully and harm the results of our operations.
Cash and cash equivalents on the Consolidated Balance Sheets include funds available for general corporate
purposes. Fiduciary cash and receivables cannot be used for general corporate purposes. Insurance premiums, claims funds,
and surplus lines taxes are held in a fiduciary capacity and the obligation to remit these funds are recorded as Fiduciary
liabilities on the Consolidated Balance Sheets. We recognize fiduciary amounts due to others as Fiduciary liabilities and
fiduciary amounts collectible and held on behalf of others, including insurance carriers, other insurance intermediaries,
surplus lines taxing authorities, clients, and insurance policy holders, as Fiduciary cash and receivables on the Consolidated
Balance Sheets.
In our capacity as an insurance broker or agent, we collect premiums from insureds and, after deducting our
commission, remit the premiums to the respective insurance markets and carriers. We also collect claims prefunding or
refunds from carriers on behalf of insureds, which are then returned to the insureds, and surplus lines taxes, which are then
remitted to surplus lines taxing authorities. Insurance premiums, claims funds, and surplus lines taxes are held in a
fiduciary capacity. The levels of Fiduciary cash and receivables and Fiduciary liabilities can fluctuate significantly
depending on when we collect the premiums, claims prefunding, and refunds, make payments to markets, carriers, surplus
lines taxing authorities, and insureds, and collect funds from clients and make payments on their behalf, and upon the
impact of foreign currency movements. Fiduciary cash, because of its nature, is held in very liquid securities with a focus
on preservation of principal. To minimize counterparty investment risk, we maintain cash holdings pursuant to an fiduciary
holdings policy which contemplates all relevant rules established by states with regard to fiduciary cash and is approved by
our Board of Directors. The policy requires broad diversification of holdings across a variety of counterparties utilizing
limits set by our Board of Directors, primarily based on credit rating and type of investment. Fiduciary cash and receivables
included cash of $1,426.1 million and $1,140.6 million as of December 31, 2025 and 2024, respectively, and fiduciary
receivables of $2,872.8 million and $2,599.1 million as of December 31, 2025 and 2024, respectively. While we may earn
interest income on fiduciary cash held in cash and investments, the fiduciary cash may not be used for general corporate
purposes. Of the $158.3 million of Cash and cash equivalents on the Consolidated Balance Sheet as of December 31, 2025,
$91.9 million was held in fiduciary accounts representing collected revenue and was available to be transferred to operating
accounts and used for general corporate purposes.
Credit Facilities
We expect to have sufficient financial resources to meet our business requirements for the next 12 months.
Although cash from operations is expected to be sufficient to service our activities, including servicing our debt and
contractual obligations, and financing capital expenditures, we have the ability to borrow under our Revolving Credit
73
Facility to accommodate any timing differences in cash flows. Additionally, under current market conditions, we believe
that we could access capital markets to obtain debt financing for longer-term funding, if needed.
On February 3, 2022, the LLC issued $400.0 million of 8-year Senior Secured Notes. The notes have a 4.375%
interest rate and will mature on February 1, 2030.
On January 19, 2024, we entered into the Fifth Amendment to the Credit Agreement, which reduced the
applicable interest rate of the Term Loan from Adjusted Term SOFR + 3.00% to Adjusted Term SOFR + 2.75% and no
longer contains a credit spread adjustment. All other material provisions remain unchanged.
On July 30, 2024, the Company entered into the Sixth Amendment to the Credit Agreement, which provided for
an increase in borrowing capacity under the Revolving Credit Facility from $600.0 million to $1,400.0 million. The
amendment also extended the maturity date of the Revolving Credit Facility to July 30, 2029, and reduced the applicable
interest rate from Adjusted Term SOFR plus a margin of 2.50% to 3.00% to Adjusted Term SOFR plus a margin of 2.00%
to 2.50%, based on the first lien net leverage ratio defined in the Credit Agreement.
On September 13, 2024, the Company entered into the Seventh Amendment to the Credit Agreement, which
refinanced the existing Term Loan in the aggregate principal amount of $1,588.1 million outstanding as of June 30, 2024,
and increased the size of the Term Loan by $111.9 million to $1,700.0 million as of September 30, 2024. In addition to
increasing the size of the Term Loan, the Seventh Amendment reduced the applicable interest rate of the Term Loan from
Adjusted Term SOFR plus a margin of 2.75% to Adjusted Term SOFR plus a margin of 2.25% and lowered the 75 basis
point floor on Adjusted Term SOFR to a 0 basis point floor. In August 2025, Moody’s Ratings upgraded the Company’s
credit rating from B1 to Ba3. As a result, the applicable interest rate on the Company’s Term Loan decreased from
Adjusted Term SOFR + 2.25% to Adjusted Term SOFR + 2.00%.
On September 19, 2024, the LLC issued $600.0 million of 8-year Senior Secured Notes. On December 9, 2024,
the LLC issued an additional $600.0 million of its 2032 Senior Secured Notes as “additional notes” under a supplement to
the indenture dated as of September 2024. All of the 2032 Senior Secured Notes carry a 5.875% interest rate and will
mature on August 1, 2032.
As of December 31, 2025, the interest rate on the Term Loan was 2.00% plus Adjusted Term SOFR.
As of December 31, 2025, we were in compliance with all of the covenants under our debt facilities and there
were no events of default for the year ended December 31, 2025.
Tax Receivable Agreement
The Company is party to a TRA with current and certain former LLC Unitholders. The TRA provides for the
payment by the Company, to current and certain former LLC Unitholders, of 85% of the net cash savings, if any, in U.S.
federal, state, and local income taxes that the Company realizes (or is deemed to realize in certain circumstances) as a result
of (i) certain increases in the tax basis of the assets of the LLC resulting from purchases or exchanges of LLC Common
Units (“Exchange Tax Attributes”), (ii) certain tax attributes of the LLC that existed prior to the IPO (“Pre-IPO M&A Tax
Attributes”), (iii) certain favorable “remedial” partnership tax allocations to which the Company becomes entitled to (if
any), and (iv) certain other tax benefits related to the Company entering into the TRA, including tax benefits attributable to
payments that the Company makes under the TRA (“TRA Payment Tax Attributes”). The Company recognizes a liability
on the Consolidated Balance Sheets based on the undiscounted estimated future payments under the TRA.
Due to the uncertainty of various factors, we cannot precisely quantify the likely tax benefits we will realize as
a result of the LLC Common Unit exchanges and the resulting amounts we are likely to pay out to current and certain
former LLC Unitholders pursuant to the TRA; however, we estimate that such tax benefits and the related TRA payments
may be substantial. As set forth in the table below, and assuming no changes in the relevant tax law and that we earn
sufficient taxable income to realize all cash tax savings that are subject to the TRA, we expect future payments under the
TRA to be $459.0 million in aggregate as of December 31, 2025. Future payments in respect to subsequent exchanges
would be in addition to these amounts and are expected to be substantial. The foregoing amounts are merely estimates and
the actual payments could differ materially. In the highly unlikely event of an early termination of the TRA (e.g., a default
by the Company or a Change of Control) the Company is required to pay to each holder of the TRA an early termination
payment equal to the discounted present value of all unpaid TRA payments. The Company has not made, and is not likely
to make, an election for an early termination. We expect to fund future TRA payments with tax distributions from the LLC
that come from cash on hand and cash generated from operations.
74
(in thousands) | Exchange Tax Attributes | Pre-IPO M&A Tax Attributes | TRA Payment Tax Attributes | TRA Liabilities | ||||
Balance at December 31, 2024 | $253,233 | $83,415 | $99,648 | $436,296 | ||||
Exchange of LLC Common Units | 34,813 | 2,466 | 9,479 | 46,758 | ||||
Interest expense | — | — | 1,112 | 1,112 | ||||
Payments | (16,067) | (8,532) | (570) | (25,169) | ||||
Balance at December 31, 2025 | $271,979 | $77,349 | $109,669 | $458,997 |
Total expected estimated tax savings from each of the tax attributes associated with the TRA as of
December 31, 2025 were $540.0 million consisting of (i) Exchange Tax Attributes of $320.0 million, (ii) Pre-IPO M&A
Tax Attributes of $91.0 million, and (iii) TRA Payment Tax Attributes of $129.0 million. The Company will retain the
benefit of 15% of these cash savings.
Comparison of Cash Flows for the Year Ended December 31, 2025 and 2024
Cash and cash equivalents decreased $381.9 million from $540.2 million at December 31, 2024, to $158.3
million at December 31, 2025. A summary of our cash flows provided by and used for ongoing operations from operating,
investing, and financing activities is as follows:
Cash Flows From Operating Activities
Net cash provided by operating activities during the year ended December 31, 2025, increased $128.8 million
from the year ended December 31, 2024, to $643.7 million. This increase in cash flows provided by operating activities
was driven by increases of $116.6 million in Amortization, $39.1 million in Deferred income tax expense from common
control reorganizations, and $38.6 million related to Other current and non-current assets and Other current and non-
current liabilities. These increases were partially offset by the change in Commissions and fees receivable - net of $35.6
million, a decline in Net income of $15.8 million, and a decrease of Amortization of deferred debt issuance costs of $14.4
million.
Cash Flows From Investing Activities
Cash flows used in investing activities during the year ended December 31, 2025, were $834.0 million, a
decrease of $921.7 million compared to the $1,755.7 million of cash flows used for investing activities during the year
ended December 31, 2024. The main drivers of the cash flows used for investing activities for the year ended December 31,
2025, were $746.5 million of Business combinations - net of cash acquired and cash held in a fiduciary capacity, Capital
expenditures of $68.0 million, $16.6 million of an Equity method investment in VSIC, and $3.0 million related to Asset
acquisitions. The main drivers of the cash flows used for investing activities for the year ended December 31, 2024, were
$1,708.7 million of Business combinations - net of cash acquired and cash held in a fiduciary capacity and $47.0 million of
capital expenditures.
Cash Flows From Financing Activities
Cash flows provided by financing activities during the year ended December 31, 2025, were $78.1 million, a
decrease of $1,088.7 million compared to cash flows provided by financing activities of $1,166.9 million during the year
ended December 31, 2024. The main drivers of cash flows provided by financing activities during the year ended
December 31, 2025, were $237.6 million Net change in fiduciary liabilities, net Borrowings on Revolving Credit Facility
of $71.4 million, and $35.9 million of Receipt of taxes related to net share settlement of equity awards offset by $64.1
million of Tax distributions to non-controlling LLC Unitholders, $62.3 million of Class A common stock dividends and
Dividend Equivalents paid, $37.0 million of Taxes paid related to net share settlement of equity awards, $29.3 million of
Payment of contingent consideration, $27.2 million of Distributions and Declared Distributions paid to non-controlling
LLC Unitholders, $25.2 million of Payment of Tax Receivable Agreement liabilities during the year, and $17.0 million of
Repayment of term debt. The main drivers of cash flows provided by financing activities during the year ended December
31, 2024, were $1,187.4 million of Proceeds from Senior Secured Notes, $114.0 million Net change in fiduciary liabilities,
and $107.6 million of Proceeds from term debt offset by $82.7 million of Tax distributions to non-controlling LLC
Unitholders, $80.2 million of Class A common stock dividends and Dividend Equivalents paid, $25.5 million of Debt
issuance costs paid, $22.2 million of Distributions and Declared Distributions paid to non-controlling LLC Unitholders,
and $21.6 million of Payment of Tax Receivable Agreement liabilities during the year.
75
Contractual Obligations and Commitments
Our principal commitments consist of contractual obligations in connection with investing and operating
activities. These obligations are described within “Note 8, Debt” in the notes to our audited consolidated financial
statements in this Annual Report, where we provide further description on provisions that create, increase or accelerate
obligations, or other pertinent data to the extent necessary for an understanding of the timing and amount of the specified
contractual obligations.
The Company recognized a liability for employee deferrals, inclusive of changes in the value of deferred
amounts held, of $8.0 million and $50.8 million in Current accrued compensation and Non-current accrued compensation,
respectively, on the Consolidated Balance Sheets as of December 31, 2025, and $5.2 million and $36.5 million in Current
accrued compensation and Non-current accrued compensation, respectively, on the Consolidated Balance Sheets as of
December 31, 2024. The timing of when employees elect to make withdrawals from the deferred compensation plan is
uncertain, however employees are not allowed to make a withdrawal for three years from the deferral date and must
withdraw all deferred compensation balances within ten years of the deferral date.
Within Current accrued compensation and Non-current accrued compensation we have various long-term
incentive compensation agreements accrued for. These agreements are typically associated with an acquisition. Below we
have outlined the liabilities accrued as of December 31, 2025, the projected future expense, and the projected timing of
future cash outflows associated with these arrangements.
Long-term Incentive Compensation Agreements | ||
(in thousands) | December 31, 2025 | |
Current accrued compensation | $10,752 | |
Non-current accrued compensation | 19,212 | |
Total liability | $29,963 | |
Projected future expense | 44,880 | |
Total projected future cash outflows | $74,843 | |
Projected Future Cash Outflows | ||
(in thousands) | ||
2026 | $14,632 | |
2027 | 9,274 | |
2028 | 32,257 | |
2029 | 11,048 | |
Thereafter | $7,632 | |
76
Within “Note 4, Mergers and Acquisitions” in the notes to our audited consolidated financial statements in this
Annual Report we outline various contingent consideration arrangements and their impact. Below we have outlined the
liabilities accrued as of December 31, 2025, the projected future expense, and the projected timing of future cash outflows
associated with these contingent consideration agreements.
Contingent Consideration | ||
(in thousands) | December 31, 2025 | |
Current accounts payable and accrued liabilities | $55,880 | |
Other non-current liabilities | 92,508 | |
Total liability | $148,388 | |
Projected future expense | 10,429 | |
Total projected future cash outflows | $158,817 | |
Projected Future Cash Outflows | ||
(in thousands) | ||
2026 | $57,255 | |
2027 | 89,016 | |
2028 | 6,262 | |
2029 | 4,662 | |
Thereafter | $1,622 | |
Critical Accounting Policies and Estimates
The methods, assumptions, and estimates that we use in applying the accounting policies may require us to
apply judgments regarding matters that are inherently uncertain. We consider an accounting policy to be a critical estimate
if (i) the Company must make assumptions that were uncertain when the judgment was made and (ii) changes in the
estimate assumptions or selection of a different estimate methodology could have a significant impact on our financial
position and the results that we report in the consolidated financial statements. While we believe that the estimates,
assumptions, and judgments are reasonable, they are based on information available when the estimate was made. Refer to
“Note 2, Summary of Significant Accounting Policies” in the consolidated financial statements in this Annual Report for
further information on the critical accounting estimates and policies.
Business Combinations
The Company accounts for transactions that represent business combinations under the acquisition method of
accounting, which requires us to allocate the total consideration transferred for each acquisition to the assets we acquire
and liabilities we assume based on their fair values as of the date of acquisition, including identifiable intangible assets.
The allocation of the consideration utilizes significant estimates in determining the fair values of identifiable assets
acquired, which mainly consist of customer relationship intangible assets. The significant assumptions used in determining
the fair value of customer relationships include estimated revenue growth, attrition rates, operating margins, and weighted-
average cost of capital. These estimates directly impact the amount of identified intangible assets recognized and the
related amortization expense in future periods. As of December 31, 2025 and 2024, an aggregate of $1,496.9 million and
$1,392.0 million, respectively, of Customer relationships was recorded on the Consolidated Balance Sheets.
The excess of purchase price over the fair value of assets acquired and liabilities assumed is recorded as
goodwill. We may refine our estimates and make adjustments to the assets acquired and liabilities assumed over a
measurement period, not to exceed one year from the date of acquisition.
Acquired Customer Relationships
We review acquired intangible assets that are being amortized for impairment whenever events or changes in
circumstance indicate that their carrying amount may not be recoverable. We have not made any material changes in the
accounting methodology used to evaluate the impairment of goodwill or amortizable intangible assets during the last three
fiscal years. Qualitative factors considered include any adverse developments in regulation, unfavorable market conditions,
or the extent to which an asset will be utilized. As we continue to experience revenue growth driven by the increase in
complexity and inflow of risks into the specialty and E&S markets, we do not believe there is a reasonable likelihood there
77
will be a material change in the estimates or assumptions used to calculate impairments or useful lives of amortizable
intangible assets. However, if actual results are not consistent with our estimates and assumptions, we may be exposed to
an acceleration of amortization or impairment losses that could be material.
Contingent Consideration
The Company recognizes contingent consideration liabilities and contingently returnable consideration resulting
from certain business combinations. We estimate the fair value of these contingent consideration arrangements using Level
3 inputs that require the use of numerous assumptions and Monte Carlo simulations, which may change based on the
occurrence of future events and lead to increased or decreased operating income in future periods. Estimating the fair value
at the acquisition date and in subsequent periods involves significant judgments, including projecting the future financial
performance of the acquired businesses. The Company updates its assumptions each reporting period based on new
developments and records such amounts at fair value based on the revised assumptions. For significant acquisitions we
may use independent third-party valuation specialists to assist us in determining the fair value of assets acquired and
liabilities assumed. Refer to “Note 14, Fair Value Measurements” in the consolidated financial statements in this Annual
Report for further information on the assumptions used in the fair value of contingent consideration.
As of December 31, 2025, the Company had nine contingent consideration liability arrangements outstanding,
with an aggregate fair value of $148.4 million. If remaining targets were to be met for these contingent consideration
arrangements, the maximum amount of the liability would be $597.4 million as of December 31, 2025, and the additional
expense would be recorded over the next 4.3 years in Change in contingent consideration within the Consolidated
Statements of Income. As of December 31, 2025, the Company had one contingently returnable consideration arrangement
outstanding for $6.6 million. The maximum amount of the asset would be $13.5 million as of December 31, 2025, if certain
targets were not achieved, and the additional income would be recorded over the next 1.3 years in Change in contingent
consideration within the Consolidated Statements of Income. Refer to “Note 4, Mergers and Acquisitions” in the
consolidated financial statements in this Annual Report for further information on business combinations and contingent
consideration.
Income Taxes
As of December 31, 2025 and 2024, $310.1 million and $448.3 million, respectively, of Deferred tax assets
were recorded on the Consolidated Balance Sheets. Deferred income taxes are recognized for the expected future tax
consequences attributable to temporary differences between the carrying amount of the existing tax assets and liabilities
and their respective tax basis. The primary item giving rise to temporary differences is the Company’s investment in the
LLC. As of December 31, 2025 and 2024, the Company’s deferred tax asset in the Company’s investment in the LLC was
$288.0 million and $429.9 million, respectively.
In determining the provision for income taxes, we make estimates and judgments which affect our evaluation of
the carrying value of our deferred tax assets as well as our calculation of certain tax liabilities. We evaluate these assets on
a quarterly basis to conclude whether they are more likely than not to be realized. In completing this evaluation related to
the Company’s deferred tax asset in the investment in the LLC, we consider all available positive and negative evidence,
including future reversals of existing taxable temporary differences, projected future taxable income, tax-planning
strategies, carryback potential if permitted under the applicable tax law, and results of recent operations. Projected future
taxable income is based on Board-approved budgets and long-term assumptions, which include revenue growth and
operating margins, among other factors. Estimating future taxable income is inherently uncertain and requires judgment.
We exclude any projected M&A activity from this evaluation.
To the extent we do not generate sufficient federal taxable income to realize a deferred tax asset in any given
year, it would result in a federal net operating loss (“NOL”) that is available to us to utilize over an indefinite carryforward
period to fully realize the deferred tax assets. Given our historical ability to generate federal taxable income and our
projected future taxable income, and the indefinite carryforward period available for federal NOLs, we consider it more
likely than not that we will realize this deferred tax asset. If we determine in the future that we will not be able to fully
utilize all or part of this deferred tax asset, we would record a valuation allowance through earnings in the period the
determination was made, which would have an adverse effect on our results of operations and earnings in those future
periods.
Changes in tax laws and rates could also affect recorded deferred tax assets and liabilities in the future. Other
than those potential impacts, we do not believe there is a reasonable likelihood there will be a material change in our tax
related balances or valuation allowances. However, due to the complexity of some of these uncertainties, the ultimate
resolution may result in a payment that is materially different from the current estimate of the tax liabilities.
78
Tax Receivable Agreement Liabilities
In connection with the Organizational Transactions and IPO, the Company entered into a TRA with current and
certain former LLC Unitholders. Amounts payable under the TRA are contingent upon, among other things, (i) the
generation of future taxable income over the term of the TRA and (ii) future changes in tax laws, including tax rate
changes. If we do not generate sufficient taxable income in the aggregate over the term of the TRA to utilize the tax
benefits, then we would not be required to make the related TRA payments. Therefore, we only recognize a liability for
TRA payments if we determine it is probable that we will generate sufficient future taxable income over the term of the
TRA to utilize the related tax benefits. Projecting future taxable income is inherently uncertain and requires judgment. In
projecting future taxable income, we consider our historical results and incorporate assumptions from our Board-approved
budgets and longer-term assumptions, which include revenue growth and operating margins, among other factors. We
exclude any projected M&A activity from this evaluation.
As of December 31, 2025 and 2024, we recognized $459.0 million and $436.3 million, respectively, of
liabilities relating to our obligations under the TRA, after concluding that it was probable that we would have sufficient
future taxable income to utilize the related tax benefits. There were no transactions subject to the TRA for which we did not
recognize the related liability, as we concluded that we would have sufficient future taxable income to utilize all of the
related tax benefits that have been generated since the IPO. If a valuation allowance is recorded against the deferred tax
assets subject to the TRA in a future period, the corresponding TRA liability may not be considered probable, resulting in
the liability being removed from the Consolidated Balance Sheets and recorded in Other non-operating loss (income) on
the Consolidated Statements of Income. Refer to “Note 17, Income Taxes” in the consolidated financial statements in this
Annual Report for further information on the estimates involved in income taxes and the TRA liability.
Recent Accounting Pronouncements
For a description of recently issued accounting pronouncements see “Note 2, Summary of Significant
Accounting Policies” in the footnotes to the consolidated financial statements in this Annual Report.
79
ITEM 7A. QUANTITATIVE AND QUALITATIVE DISCLOSURES ABOUT MARKET RISK
We are exposed to various market risks in the day-to-day operations of our business. Market risk is the potential
loss arising from adverse changes in market rates and prices, such as interest and foreign currency exchange rates.
Foreign Currency Risk
For the year ended December 31, 2025, approximately 6% of revenues were generated from activities in the
United Kingdom, Europe, Canada, and Singapore. We are exposed to currency risk from the potential changes between the
exchange rates of the US Dollar, British Pound, Euro, Swedish Krona, Canadian Dollar, Indian Rupee, Singapore Dollar
and other currencies. The exposure to foreign currency risk from the potential changes between the exchange rates between
the USD and other currencies is immaterial.
Interest Rate Risk and Credit Risk
Certain of the Company’s revenues, expenses, assets and liabilities are exposed to the impact of interest rate
changes. Interest rate risk and credit risk to counterparties generated from the Company’s Cash and cash equivalents, and
Cash and cash equivalents held in a fiduciary capacity will fluctuate with the general level of interest rates.
As of December 31, 2025, we had $1,683.0 million of outstanding principal on our Term Loan borrowings,
which bears interest on a floating rate, subject to a 0.00% floor. We are subject to Adjusted Term SOFR interest rate
changes and exposure in excess of the floor. The fair value of the Term Loan approximates the carrying amount as of
December 31, 2025, as determined based upon information available.
Based on the below balances as of December 31, 2025, the impact of a hypothetical 100 basis point (BPS)
increase or decrease in year-end prevailing short-term interest rates for one year would be:
(in thousands) | Balance at December 31, 2025 | 100 BPS Increase | 100 BPS Decrease | |||
Cash and cash equivalents | $158,322 | $(1,583) | $1,583 | |||
Term Loan principal outstanding (1) | 1,683,000 | 16,830 | $(16,830) | |||
Net exposure to Interest expense, net | 15,247 | (15,247) | ||||
Cash and cash equivalents held in a fiduciary capacity | 1,426,148 | 14,261 | $(14,261) | |||
Net exposure to Fiduciary investment income | $14,261 | $(14,261) | ||||
Impact to Net income | $(985) | $985 |
(1)To the extent SOFR falls below 0.00%, the impact of a change in interest rates is zero.
In addition to interest rate risk, our cash investments and fiduciary cash holdings are subject to potential loss of
value due to counterparty credit risk. To minimize this risk, the Company and its subsidiaries hold funds pursuant to an
investment policy approved by our Board. The policy mandates the preservation of principal and liquidity and requires
broad diversification with counter-party limits assigned based primarily on credit rating and type of investment. The
Company carefully monitors its cash, cash equivalents, and cash and cash equivalents held in a fiduciary capacity, and
plans to further restrict the portfolio as appropriate with respect to market conditions. The majority of Cash and cash
equivalents and Cash and cash equivalents held in a fiduciary capacity are held in demand deposit accounts and short-term
investments, consisting principally of AAA-rated money market funds and treasury bills, having original maturities of 90
days or less.
Other financial instruments consist of Cash and cash equivalents, Commissions and fees receivable – net, Other
current assets, and Accounts payable and accrued liabilities. The carrying amounts of Cash and cash equivalents,
Commissions and fees receivable – net, and Accounts payable and accrued liabilities approximate fair value because of the
short-term nature of the instruments.
80
ITEM 8. FINANCIAL STATEMENTS AND SUPPLEMENTARY DATA
Index to Consolidated Financial Statements
Consolidated Statements of Income for the years ended December 31, 2025, 2024, and 2023 | |
Consolidated Statements of Comprehensive Income for the years ended December 31, 2025, 2024, and 2023 | |
Consolidated Balance Sheets as of December 31, 2025, and 2024 | |
Consolidated Statements of Cash Flows for the years ended December 31, 2025, 2024, and 2023 | |
Consolidated Statements of Stockholders’ Equity for the years ended December 31, 2025, 2024, and 2023 | |
81
Report of Independent Registered Public Accounting Firm
To the shareholders and the Board of Directors of Ryan Specialty Holdings, Inc.
Opinions on the Financial Statements and Internal Control over Financial Reporting
We have audited the accompanying consolidated balance sheets of Ryan Specialty Holdings, Inc., and subsidiaries (the
“Company”) as of December 31, 2025 and 2024, the related consolidated statements of income, comprehensive income,
stockholders’ equity, and cash flows, for each of the three years in the period ended December 31, 2025, and the related
notes (collectively referred to as the “financial statements”). We also have audited the Company’s internal control over
financial reporting as of December 31, 2025, based on criteria established in Internal Control — Integrated Framework
(2013) issued by the Committee of Sponsoring Organizations of the Treadway Commission (COSO).
In our opinion, the financial statements referred to above present fairly, in all material respects, the financial position of the
Company as of December 31, 2025 and 2024, and the results of its operations and its cash flows for each of the three years
in the period ended December 31, 2025, in conformity with accounting principles generally accepted in the United States of
America. Also, in our opinion, the Company maintained, in all material respects, effective internal control over financial
reporting as of December 31, 2025, based on criteria established in Internal Control — Integrated Framework (2013)
issued by COSO.
Basis for Opinions
The Company’s management is responsible for these financial statements, for maintaining effective internal control over
financial reporting, and for its assessment of the effectiveness of internal control over financial reporting, included in the
accompanying Management Report on Internal Control. Our responsibility is to express an opinion on these financial
statements and an opinion on the Company’s internal control over financial reporting based on our audits. We are a public
accounting firm registered with the Public Company Accounting Oversight Board (United States) (PCAOB) and are
required to be independent with respect to the Company in accordance with the U.S. federal securities laws and the
applicable rules and regulations of the Securities and Exchange Commission and the PCAOB.
We conducted our audits in accordance with the standards of the PCAOB. Those standards require that we plan and
perform the audits to obtain reasonable assurance about whether the financial statements are free of material misstatement,
whether due to error or fraud, and whether effective internal control over financial reporting was maintained in all material
respects.
Our audits of the financial statements included performing procedures to assess the risks of material misstatement of the
financial statements, whether due to error or fraud, and performing procedures to respond to those risks. Such procedures
included examining, on a test basis, evidence regarding the amounts and disclosures in the financial statements. Our audits
also included evaluating the accounting principles used and significant estimates made by management, as well as
evaluating the overall presentation of the financial statements. Our audit of internal control over financial reporting
included obtaining an understanding of internal control over financial reporting, assessing the risk that a material weakness
exists, and testing and evaluating the design and operating effectiveness of internal control based on the assessed risk. Our
audits also included performing such other procedures as we considered necessary in the circumstances. We believe that
our audits provide a reasonable basis for our opinions.
Definition and Limitations of Internal Control over Financial Reporting
A company’s internal control over financial reporting is a process designed to provide reasonable assurance regarding the
reliability of financial reporting and the preparation of financial statements for external purposes in accordance with
generally accepted accounting principles. A company’s internal control over financial reporting includes those policies and
procedures that (1) pertain to the maintenance of records that, in reasonable detail, accurately and fairly reflect the
transactions and dispositions of the assets of the company; (2) provide reasonable assurance that transactions are recorded
as necessary to permit preparation of financial statements in accordance with generally accepted accounting principles, and
that receipts and expenditures of the company are being made only in accordance with authorizations of management and
directors of the company; and (3) provide reasonable assurance regarding prevention or timely detection of unauthorized
acquisition, use, or disposition of the company’s assets that could have a material effect on the financial statements.
Because of its inherent limitations, internal control over financial reporting may not prevent or detect misstatements. Also,
projections of any evaluation of effectiveness to future periods are subject to the risk that controls may become inadequate
because of changes in conditions, or that the degree of compliance with the policies or procedures may deteriorate.
82
Critical Audit Matter
The critical audit matter communicated below arises from the current-period audit of the financial statements that were
communicated or required to be communicated to the audit committee and that (1) relate to accounts or disclosures that are
material to the financial statements and (2) involved our especially challenging, subjective, or complex judgments. The
communication of critical audit matter does not alter in any way our opinion on the financial statements, taken as a whole,
and we are not, by communicating the critical audit matter below, providing separate opinions on the critical audit matter
or on the accounts or disclosures to which they relate.
Mergers and Acquisitions – Valuation of Certain Newly Acquired Customer Relationships — Refer to Notes 2, 4, and 6
to the consolidated financial statements
Critical Audit Matter Description
The Company completed the acquisitions of Velocity Risk Underwriters, LLC (“Velocity”), J.M. Wilson Corporation (“JM
Wilson”), and Stewart Specialty Risk Underwriting Ltd. (“SSRU”) during the year ended December 31, 2025, and
allocated $307.3 million of purchase consideration to customer relationships. The Company accounts for transactions that
represent business combinations under the acquisition method of accounting, which requires the Company to allocate the
total consideration transferred for each acquisition to the assets acquired and liabilities assumed based on their fair values
as of the date of acquisition, including identifiable intangible assets.
The allocation of the total consideration for Velocity, JM Wilson, and SSRU utilizes significant estimates in determining
the fair values of identifiable assets acquired, especially with respect to intangible assets. Estimating the fair value for
Velocity, JM Wilson, and SSRU, at the applicable acquisition dates, involves significant judgments, including projecting
the future financial performance of the acquired businesses.
Auditing the purchase price allocated to identifiable intangible assets, specifically customer relationships, involved a high
degree of auditor judgment related to management’s assumptions and estimates. The significant assumptions used to
estimate the fair value of the customer relationships included discount rates, attrition rates, and revenue growth rates. These
assumptions are forward-looking and could be affected by future economic and market conditions.
How the Critical Audit Matter Was Addressed in the Audit
Our audit procedures related to the valuation of acquired customer relationships for Velocity, JM Wilson, and SSRU
included the following, among others:
•We tested the design, implementation and operating effectiveness of internal controls that address the risks of
material misstatements relating to the purchase price allocated to customer relationships, including management’s
controls over the assumption setting including discount rates, attrition rates, and revenue growth rates.
•We compared the purchase price allocated to customer relationships to comparable transactions within the
industry.
•With the assistance of our internal fair value specialists, we performed the following:
◦We evaluated the reasonableness of the valuation methodology.
◦We evaluated the reasonableness of significant assumptions used to estimate purchase price allocated to
customer relationships including discount rates, attrition rates, and revenue growth rates.
◦We reperformed the mathematical accuracy of the calculation of customer relationships.
/s/ Deloitte & Touche LLP
Chicago, Illinois
February 13, 2026
We have served as the Company’s auditor since 2011.
83
Ryan Specialty Holdings, Inc.
Consolidated Statements of Income
(In thousands, except share and per share data)
Year Ended December 31, | ||||||
2025 | 2024 | 2023 | ||||
REVENUE | ||||||
Net commissions and fees | $2,994,582 | $2,455,671 | $2,026,596 | |||
Fiduciary investment income | 56,544 | 60,039 | 50,953 | |||
Total revenue | $3,051,126 | $2,515,710 | $2,077,549 | |||
EXPENSES | ||||||
Compensation and benefits | 1,803,397 | 1,591,077 | 1,321,029 | |||
General and administrative | 453,452 | 352,050 | 276,181 | |||
Amortization | 274,426 | 157,845 | 106,799 | |||
Depreciation | 13,089 | 9,785 | 9,038 | |||
Change in contingent consideration | 13,122 | (22,859) | 5,421 | |||
Total operating expenses | $2,557,486 | $2,087,898 | $1,718,468 | |||
OPERATING INCOME | $493,640 | $427,812 | $359,081 | |||
Interest expense, net | 222,384 | 158,448 | 119,507 | |||
Income from equity method investments | (21,236) | (18,231) | (8,731) | |||
Other non-operating loss (income) | (692) | 15,041 | 10,380 | |||
INCOME BEFORE INCOME TAXES | $293,184 | $272,554 | $237,925 | |||
Income tax expense | 79,027 | 42,641 | 43,445 | |||
NET INCOME | $214,157 | $229,913 | $194,480 | |||
Net income attributable to non-controlling interests, net of tax | 150,758 | 135,248 | 133,443 | |||
NET INCOME ATTRIBUTABLE TO RYAN SPECIALTY HOLDINGS, INC. | $63,399 | $94,665 | $61,037 | |||
NET INCOME PER SHARE OF CLASS A COMMON STOCK: | ||||||
Basic | $0.50 | $0.78 | $0.53 | |||
Diluted | $0.47 | $0.71 | $0.52 | |||
WEIGHTED-AVERAGE SHARES OF CLASS A COMMON STOCK OUTSTANDING: | ||||||
Basic | 127,266,889 | 120,781,234 | 114,359,968 | |||
Diluted | 138,246,414 | 132,891,487 | 125,745,139 | |||
See accompanying Notes to the Consolidated Financial Statements
84
Ryan Specialty Holdings, Inc.
Consolidated Statements of Comprehensive Income
(In thousands)
Year Ended December 31, | ||||||
2025 | 2024 | 2023 | ||||
NET INCOME | $214,157 | $229,913 | $194,480 | |||
Net income attributable to non-controlling interests, net of tax | 150,758 | 135,248 | 133,443 | |||
NET INCOME ATTRIBUTABLE TO RYAN SPECIALTY HOLDINGS, INC. | $63,399 | $94,665 | $61,037 | |||
Other comprehensive income (loss), net of tax: | ||||||
Gain on interest rate cap | 3,879 | 5,613 | 4,359 | |||
Gain on interest rate cap reclassified to earnings | (5,314) | (8,875) | (7,727) | |||
Foreign currency translation adjustments | 16,788 | (3,992) | 825 | |||
Change in share of equity method investments’ other comprehensive income (loss) | 288 | 2,382 | (416) | |||
Total other comprehensive income (loss), net of tax | $15,641 | $(4,872) | $(2,959) | |||
COMPREHENSIVE INCOME ATTRIBUTABLE TO RYAN SPECIALTY HOLDINGS, INC. | $79,040 | $89,793 | $58,078 | |||
See accompanying Notes to the Consolidated Financial Statements
85
Ryan Specialty Holdings, Inc.
Consolidated Balance Sheets
(In thousands, except share and per share data)
December 31, 2025 | December 31, 2024 | |||
ASSETS | ||||
CURRENT ASSETS | ||||
Cash and cash equivalents | $158,322 | $540,203 | ||
Commissions and fees receivable – net | 488,951 | 389,758 | ||
Fiduciary cash and receivables | 4,298,920 | 3,739,727 | ||
Prepaid incentives – net | 13,550 | 9,219 | ||
Other current assets | 100,437 | 109,951 | ||
Total current assets | $5,060,180 | $4,788,858 | ||
NON-CURRENT ASSETS | ||||
Goodwill | 3,225,021 | 2,646,676 | ||
Customer relationships | 1,496,885 | 1,392,048 | ||
Other intangible assets | 119,621 | 83,674 | ||
Prepaid incentives – net | 27,849 | 17,442 | ||
Equity method investments | 109,982 | 70,877 | ||
Property and equipment – net | 69,461 | 50,209 | ||
Lease right-of-use assets | 130,480 | 133,256 | ||
Deferred tax assets | 310,138 | 448,289 | ||
Other non-current assets | 14,554 | 18,589 | ||
Total non-current assets | $5,503,991 | $4,861,060 | ||
TOTAL ASSETS | $10,564,171 | $9,649,918 | ||
LIABILITIES AND STOCKHOLDERS’ EQUITY | ||||
CURRENT LIABILITIES | ||||
Accounts payable and accrued liabilities | $284,403 | $249,200 | ||
Accrued compensation | 519,251 | 486,322 | ||
Operating lease liabilities | 25,987 | 22,107 | ||
Short-term debt and current portion of long-term debt | 60,187 | 51,732 | ||
Fiduciary liabilities | 4,298,920 | 3,739,727 | ||
Total current liabilities | $5,188,748 | $4,549,088 | ||
NON-CURRENT LIABILITIES | ||||
Accrued compensation | 70,096 | 49,362 | ||
Operating lease liabilities | 153,089 | 159,231 | ||
Long-term debt | 3,291,462 | 3,231,128 | ||
Tax Receivable Agreement liabilities | 458,997 | 436,296 | ||
Deferred tax liabilities | 49,834 | 39,922 | ||
Other non-current liabilities | 97,894 | 86,606 | ||
Total non-current liabilities | $4,121,372 | $4,002,545 | ||
TOTAL LIABILITIES | $9,310,120 | $8,551,633 | ||
STOCKHOLDERS’ EQUITY | ||||
Class A common stock ($0.001 par value; 1,000,000,000 shares authorized, 129,603,426 and 125,411,089 shares issued and outstanding at December 31, 2025 and 2024, respectively) | 130 | 125 | ||
Class B common stock ($0.001 par value; 1,000,000,000 shares authorized, 134,508,885 and 136,456,313 shares issued and outstanding at December 31, 2025 and 2024, respectively) | 135 | 136 | ||
Class X common stock ($0.001 par value; 0 shares authorized, issued, and outstanding at December 31, 2025; 10,000,000 shares authorized, 640,784 shares issued, and 0 shares outstanding at December 31, 2024) | — | — | ||
Preferred stock ($0.001 par value; 500,000,000 shares authorized, 0 shares issued and outstanding at December 31, 2025 and 2024) | — | — | ||
Additional paid-in capital | 513,610 | 506,258 | ||
Retained earnings | 120,353 | 122,939 | ||
Accumulated other comprehensive income (loss) | 13,845 | (1,796) | ||
Total stockholders’ equity attributable to Ryan Specialty Holdings, Inc. | $648,073 | $627,662 | ||
Non-controlling interests | 605,978 | 470,623 | ||
Total stockholders’ equity | $1,254,051 | $1,098,285 | ||
TOTAL LIABILITIES AND STOCKHOLDERS’ EQUITY | $10,564,171 | $9,649,918 |
See accompanying Notes to the Consolidated Financial Statements
86
Ryan Specialty Holdings, Inc.
Consolidated Statements of Cash Flows
(In thousands)
Year Ended December 31, | ||||||
2025 | 2024 | 2023 | ||||
CASH FLOWS FROM OPERATING ACTIVITIES | ||||||
Net income | $214,157 | $229,913 | $194,480 | |||
Adjustments to reconcile net income to cash flows provided by operating activities: | ||||||
Income from equity method investments | (21,236) | (18,231) | (8,731) | |||
Amortization | 274,426 | 157,845 | 106,799 | |||
Depreciation | 13,089 | 9,785 | 9,038 | |||
Prepaid and deferred compensation expense | 38,779 | 30,834 | 12,192 | |||
Non-cash equity-based compensation | 69,451 | 78,995 | 69,743 | |||
Amortization of deferred debt issuance costs | 9,567 | 23,930 | 12,172 | |||
Amortization of interest rate cap premium | 6,955 | 6,955 | 6,955 | |||
Deferred income tax expense | 26,047 | 16,798 | 7,134 | |||
Deferred income tax expense from common control reorganizations | 48,597 | 9,519 | 18,356 | |||
Loss (gain) on Tax Receivable Agreement | 1,112 | (2,099) | 11,170 | |||
Changes in operating assets and liabilities, net of acquisitions: | ||||||
Commissions and fees receivable – net | (57,559) | (22,007) | (44,185) | |||
Accrued interest liability | 9,362 | 20,337 | 934 | |||
Other current and non-current assets | 1,255 | (20,668) | 5,773 | |||
Other current and non-current liabilities | 9,665 | (7,038) | 75,373 | |||
Total cash flows provided by operating activities | $643,667 | $514,868 | $477,203 | |||
CASH FLOWS FROM INVESTING ACTIVITIES | ||||||
Business combinations – net of cash acquired and cash held in a fiduciary capacity | (746,485) | (1,708,737) | (446,682) | |||
Capital expenditures | (67,953) | (47,001) | (29,776) | |||
Equity method investment in VSIC | (16,561) | — | — | |||
Asset acquisitions | (3,014) | — | — | |||
Repayments of prepaid incentives | — | — | 228 | |||
Total cash flows used in investing activities | $(834,013) | $(1,755,738) | $(476,230) | |||
CASH FLOWS FROM FINANCING ACTIVITIES | ||||||
Proceeds from Senior Secured Notes | — | 1,187,400 | — | |||
Borrowings on Revolving Credit Facility | 1,333,328 | 1,250,000 | — | |||
Repayments on Revolving Credit Facility | (1,261,928) | (1,250,000) | — | |||
Debt issuance costs paid | (2,889) | (25,536) | — | |||
Proceeds from term debt | — | 107,625 | — | |||
Repayment of term debt | (17,000) | (8,250) | (16,500) | |||
Receipt of contingently returnable consideration | 1,927 | — | — | |||
Payment of contingent consideration | (29,252) | — | (4,477) | |||
Tax distributions to non-controlling LLC Unitholders | (64,126) | (82,702) | (71,674) | |||
Receipt of taxes related to net share settlement of equity awards | 35,900 | 27,930 | 7,811 | |||
Taxes paid related to net share settlement of equity awards | (37,045) | (27,460) | (8,785) | |||
Payment of Tax Receivable Agreement liabilities | (25,169) | (21,578) | (16,206) | |||
Class A common stock dividends and Dividend Equivalents paid | (62,339) | (80,236) | — | |||
Distributions and Declared Distributions paid to non-controlling LLC Unitholders | (27,174) | (22,209) | — | |||
Payments related to Ryan Re preferred units | (3,733) | (2,130) | — | |||
Net change in fiduciary liabilities | 237,616 | 114,003 | 97,221 | |||
Total cash flows provided by (used in) financing activities | $78,116 | $1,166,857 | $(12,610) | |||
Effect of changes in foreign exchange rates on cash, cash equivalents, and cash and cash equivalents held in a fiduciary capacity | 15,895 | (1,514) | 584 | |||
NET CHANGE IN CASH, CASH EQUIVALENTS, AND CASH AND CASH EQUIVALENTS HELD IN A FIDUCIARY CAPACITY | $(96,335) | $(75,527) | $(11,053) | |||
CASH, CASH EQUIVALENTS, AND CASH AND CASH EQUIVALENTS HELD IN A FIDUCIARY CAPACITY—Beginning balance | 1,680,805 | 1,756,332 | 1,767,385 | |||
CASH, CASH EQUIVALENTS, AND CASH AND CASH EQUIVALENTS HELD IN A FIDUCIARY CAPACITY—Ending balance | $1,584,470 | $1,680,805 | $1,756,332 | |||
Reconciliation of cash, cash equivalents, and cash and cash equivalents held in a fiduciary capacity | ||||||
Cash and cash equivalents | $158,322 | $540,203 | $838,790 | |||
Cash and cash equivalents held in a fiduciary capacity | 1,426,148 | 1,140,602 | 917,542 | |||
Total cash, cash equivalents, and cash and cash equivalents held in a fiduciary capacity | $1,584,470 | $1,680,805 | $1,756,332 | |||
See accompanying Notes to the Consolidated Financial Statements
87
Ryan Specialty Holdings, Inc.
Consolidated Statements of Stockholders’ Equity
(In thousands, except share data)
Class A Common Stock | Class B Common Stock | Additional Paid-in Capital | Retained Earnings | Accumulated Other Comprehensive Income (Loss) | Non- controlling Interests | Total Stockholders’ Equity | ||||||||||||
Shares | Amount | Shares | Amount | |||||||||||||||
Balance at December 31, 2022 | 112,437,825 | $112 | 147,214,275 | $147 | $418,123 | $53,988 | $6,035 | $339,407 | $817,812 | |||||||||
Net income | — | — | — | — | — | 61,037 | — | 133,443 | 194,480 | |||||||||
Issuance of common stock | 546,045 | 1 | 62,452 | 1 | 1,227 | — | — | 1,467 | 2,696 | |||||||||
Forfeiture and retirement of common stock and clawback of vested equity awards | (53,404) | — | — | — | 464 | (605) | — | — | (141) | |||||||||
Exchange of LLC equity for common stock | 5,662,596 | 6 | (5,655,539) | (6) | 10,452 | — | — | (10,452) | — | |||||||||
Equity awards withheld for settlement of employee tax obligations | — | — | — | — | — | — | — | (975) | (975) | |||||||||
Tax Receivable Agreement liability and deferred taxes arising from LLC interest ownership changes | — | — | — | — | (41,342) | — | — | 18,906 | (22,436) | |||||||||
Distributions declared for non-controlling interest holders’ tax | — | — | — | — | — | — | — | (74,554) | (74,554) | |||||||||
Change in share of equity method investment’s other comprehensive loss | — | — | — | — | — | — | (416) | (557) | (973) | |||||||||
Loss on interest rate cap, net | — | — | — | — | — | — | (3,368) | (4,765) | (8,133) | |||||||||
Foreign currency translation adjustments | — | — | — | — | — | — | 825 | 1,300 | 2,125 | |||||||||
Equity-based compensation | — | — | — | — | 53,073 | — | — | 16,670 | 69,743 | |||||||||
Balance at December 31, 2023 | 118,593,062 | $119 | 141,621,188 | $142 | $441,997 | $114,420 | $3,076 | $419,890 | $979,644 | |||||||||
Net income | — | — | — | — | — | 94,665 | — | 135,248 | 229,913 | |||||||||
Issuance of common stock | 1,466,728 | 1 | 41,254 | — | 4,293 | — | — | 4,849 | 9,143 | |||||||||
Forfeiture and retirement of common stock and clawback of vested equity awards | (32,107) | — | — | — | 1,126 | (1,418) | — | — | (292) | |||||||||
Exchange of LLC equity for common stock | 5,383,406 | 5 | (5,206,129) | (6) | 9,326 | — | — | (9,325) | — | |||||||||
Equity awards withheld for settlement of employee tax obligations | — | — | — | — | — | — | — | (284) | (284) | |||||||||
Class A common stock dividends and Dividend Equivalents | — | — | — | — | — | (84,728) | — | — | (84,728) | |||||||||
Distributions and Declared Distributions to non- controlling LLC Unitholders | — | — | — | — | — | — | — | (22,711) | (22,711) | |||||||||
Tax Receivable Agreement liability and deferred taxes arising from LLC interest ownership changes | — | — | — | — | (3,323) | — | — | 7,552 | 4,229 | |||||||||
Distributions declared for non-controlling interest holders’ tax | — | — | — | — | — | — | — | (84,798) | (84,798) | |||||||||
Change in share of equity method investment’s other comprehensive income | — | — | — | — | — | — | 2,382 | 3,326 | 5,708 | |||||||||
Loss on interest rate cap, net | — | — | — | — | — | — | (3,262) | (4,358) | (7,620) | |||||||||
Foreign currency translation adjustments | — | — | — | — | — | — | (3,992) | (4,922) | (8,914) | |||||||||
Equity-based compensation | — | — | — | — | 52,839 | — | — | 26,156 | 78,995 | |||||||||
Balance at December 31, 2024 | 125,411,089 | $125 | 136,456,313 | $136 | $506,258 | $122,939 | $(1,796) | $470,623 | $1,098,285 | |||||||||
88
Class A Common Stock | Class B Common Stock | Additional Paid-in Capital | Retained Earnings | Accumulated Other Comprehensive Income (Loss) | Non- controlling Interests | Total Stockholders’ Equity | ||||||||||||
Shares | Amount | Shares | Amount | |||||||||||||||
Balance at December 31, 2024 | 125,411,089 | $125 | 136,456,313 | $136 | $506,258 | $122,939 | $(1,796) | $470,623 | $1,098,285 | |||||||||
Net income | — | — | — | — | — | 63,399 | — | 150,758 | 214,157 | |||||||||
Issuance of common stock | 1,635,301 | 2 | 319,911 | 1 | 13,537 | — | — | 14,962 | 28,502 | |||||||||
Cash and common stock clawbacks related to vested equity awards | (44,176) | — | — | — | 1,966 | (2,103) | — | 307 | 170 | |||||||||
Exchange of LLC equity for common stock | 2,601,212 | 3 | (2,267,339) | (2) | 3,499 | — | — | (3,500) | — | |||||||||
Equity awards withheld for settlement of employee tax obligations | — | — | — | — | (214) | — | — | (601) | (815) | |||||||||
Class A common stock dividends and Dividend Equivalents | — | — | — | — | — | (63,882) | — | — | (63,882) | |||||||||
Distributions and Declared Distributions to non- controlling LLC Unitholders | — | — | — | — | — | — | — | (27,402) | (27,402) | |||||||||
Tax Receivable Agreement liability and deferred taxes arising from LLC interest ownership changes | — | — | — | — | (68,169) | — | — | 30,917 | (37,252) | |||||||||
Distributions declared for non-controlling interest holders’ tax | — | — | — | — | — | — | — | (62,495) | (62,495) | |||||||||
Change in share of equity method investments’ other comprehensive income | — | — | — | — | — | — | 288 | 376 | 664 | |||||||||
Loss on interest rate cap, net | — | — | — | — | — | — | (1,435) | (5,026) | (6,461) | |||||||||
Foreign currency translation adjustments | — | — | — | — | — | — | 16,788 | 24,341 | 41,129 | |||||||||
Equity-based compensation | — | — | — | — | 56,733 | — | — | 12,718 | 69,451 | |||||||||
Balance at December 31, 2025 | 129,603,426 | $130 | 134,508,885 | $135 | $513,610 | $120,353 | $13,845 | $605,978 | $1,254,051 | |||||||||
See accompanying Notes to the Consolidated Financial Statements
89
Ryan Specialty Holdings, Inc.
Notes to the Consolidated Financial Statements
(Tabular amounts presented in thousands, except share and per share data)
1. BASIS OF PRESENTATION
Nature of Operations
Ryan Specialty Holdings, Inc. (the “Company”) is a service provider of specialty products and solutions for insurance
brokers, agents, and carriers. These services encompass distribution, underwriting, product development, administration,
and risk management by acting as a wholesale broker and a managing underwriter or a program administrator with
delegated authority from insurance carriers. The Company’s offerings cover a wide variety of sectors including
commercial, industrial, institutional, governmental, and personal through one operating segment, Ryan Specialty. With the
exception of the Company’s equity method investments, the Company does not take on any underwriting risk.
The Company is headquartered in Chicago, Illinois, and has operations in the United States, the United Kingdom, Europe,
Canada, India, and Singapore. The Company’s Class A common stock is traded on the New York Stock Exchange under
the ticker symbol “RYAN”.
Organization
Ryan Specialty Holdings, Inc. was formed as a Delaware corporation on March 5, 2021, for the purpose of completing an
IPO and to carry on the business of the LLC. New Ryan Specialty, LLC, or New LLC, was formed as a Delaware limited
liability company on April 20, 2021, for the purpose of becoming, subsequent to our IPO, an intermediate holding
company between Ryan Specialty Holdings, Inc. and the LLC. The Company is the sole managing member of New LLC.
New LLC is a holding company with its sole material asset being a controlling equity interest in the LLC. The Company
operates and controls the business and affairs of the LLC through New LLC and, through the LLC, conducts its business.
Accordingly, the Company consolidates the financial results of New LLC, and therefore the LLC, and reports the non-
controlling interests of New LLC’s Common Units on its consolidated financial statements. As the LLC is substantively
the same as New LLC, for the purpose of this document, we will refer to both New LLC and the LLC as the “LLC”. As of
December 31, 2025, the Company owned 49.1% of the outstanding LLC Common Units.
Basis of Presentation
The accompanying consolidated financial statements and notes thereto have been prepared in accordance with U.S. GAAP.
The consolidated financial statements include the Company’s accounts and those of all controlled subsidiaries. In the
opinion of management, the consolidated financial statements include all normal recurring adjustments necessary to present
fairly the Company’s consolidated financial position, results of operations, and cash flows for all periods presented.
Principles of Consolidation
The consolidated financial statements include the accounts of the Company and its subsidiaries that it controls due to
ownership of a majority voting interest or pursuant to variable interest entity (“VIE”) accounting. All intercompany
transactions and balances have been eliminated in consolidation.
The Company, through its intermediate holding company New LLC, owns a minority economic interest in, and operates
and controls the businesses and affairs of, the LLC. The LLC is a VIE of the Company and the Company is the primary
beneficiary of the LLC as the Company has both the power to direct the activities that most significantly impact the LLC’s
economic performance and has the obligation to absorb losses of, and receive benefits from, the LLC, which could be
significant to the Company. Accordingly, the Company has prepared these consolidated financial statements in accordance
with Accounting Standards Codification (“ASC”) 810, Consolidation (“ASC 810”). ASC 810 requires that if an entity is
the primary beneficiary of a VIE, the assets, liabilities, and results of operations of the VIE should be included in the
consolidated financial statements of such entity. The Company’s relationship with the LLC results in no recourse to the
general credit of the Company and the Company has no contractual requirement to provide financial support to the LLC.
The Company shares in the income and losses of the LLC in direct proportion to the Company’s ownership percentage.
Use of Estimates
The preparation of the consolidated financial statements and notes thereto requires management to make estimates,
judgments, and assumptions that affect the amounts reported in the consolidated financial statements and in the notes
90
thereto. Such estimates and assumptions could change in the future as circumstances change or more information becomes
available, which could affect the amounts reported and disclosed herein.
2. SUMMARY OF SIGNIFICANT ACCOUNTING POLICIES
Segment Reporting
In accordance with ASC 280, Segment Reporting, Ryan Specialty’s operations are reported as a single operating and
reporting segment. See Note 19, Segment Reporting, for additional information on the Company’s segment reporting.
Revenue Recognition
The Company generates revenues primarily through commissions and fees from customers, as well as compensation from
insurance and reinsurance companies for services provided to them.
The Company incurs both costs to fulfill contracts, principally in pre-placement activities, and costs to obtain contracts,
principally through certain sales commissions paid to employees. For situations in which the renewal period is one year or
less and renewal costs are commensurate with the initial contract, the Company applies a practical expedient and
recognizes the costs of obtaining a contract as an expense when incurred.
Net Commissions and Policy Fees
Net commissions and policy fees revenue is primarily based on a percentage of premiums or fees received for an agreed-
upon level of service. The Company’s customers for this revenue stream are agents of the insured. The net commissions
and policy fees are recognized at the point in time when an insurance policy is bound and issued, which occurs on the later
of the policy effective date or the date the Company receives a request to bind coverage from the customer. Most insurance
premiums are subject to cancellations; therefore, commission revenue is considered to be variable consideration at the
contract effective date and is recognized net of a constraint for estimated policy cancellations. Estimated policy
cancellations are based upon the Company’s historical cancellations. Any endorsement made to a contract is treated as a
new contract with revenue recognized on the later of the endorsement effective date or the date the Company receives a
request to bind coverage from the customer.
Supplemental and Contingent Commissions
Supplemental and contingent commissions are additional revenues paid to the Company based on the volume and/or
underwriting profitability of the eligible insurance contracts placed. The Company’s performance obligation is satisfied and
revenue is recognized over time using the output method as the Company places eligible or profitable policies. For this
revenue stream, the customer is the carrier as the carrier is the entity that will ultimately pay the Company additional
revenues once certain volume and/or profitability targets are achieved by the carrier. Because of the limited visibility into
the satisfaction of performance indicators outlined in the contracts, the Company constrains such revenues until the time
that the carrier provides explicit confirmation of amounts owed to the Company to avoid a significant reversal of revenue
in a future period. The uncertainty regarding the ultimate transaction price for contingent commissions is principally the
profitability of the underlying insurance policies placed as determined by the development of loss ratios maintained by the
carriers. The uncertainty is resolved over the contractual term as actual results are achieved.
Loss Mitigation Fees
Loss mitigation fees, or mergers and acquisitions (“M&A”) fees, consist of revenue earned from the review of due
diligence and other relevant information in underwriting a risk. The customer of this revenue stream is the agent of the
insured. The performance obligation is the production of an Expense Agreement (“EA”) or Letter of Intent (“LOI”). As the
M&A fees are not dependent on the outcome of the risk being insured, the Company recognizes these fees at the point in
time when control transfers to the customer, which occurs on the effective date of an executed EA or LOI.
Disaggregation of Revenue
Wholesale Brokerage revenue primarily includes insurance commissions and fees for services rendered to retail agents and
brokers, as well as supplemental and contingent commissions from carriers. Wholesale Brokerage distributes a wide range
and diversified mix of specialty property, casualty, professional lines, and workers’ compensation insurance products from
insurance carriers to retail brokerage firms.
91
Binding Authority revenue primarily includes insurance commissions, including supplemental and contingent commissions
from carriers. The Company’s binding authorities receive underwriting authority from a variety of carriers for both
Admitted and non-admitted business for small- to mid-size risks. Wholesale binding authorities generally have authority to
bind coverage on behalf of an insurance carrier for a specific type of risk, subject to agreed-upon guidelines and limits.
Wholesale binding authorities receive submissions for insurance directly from retail brokers, evaluate price, make
underwriting decisions regarding these submissions, and bind and issue policies on behalf of insurance carriers. Wholesale
binding authorities are typically created to handle large volumes of small-premium policies across commercial and
personal lines within strictly defined underwriting criteria. Binding authorities allow the insured to access additional capital
and the carrier to efficiently aggregate its distribution.
Underwriting Management revenue primarily includes insurance commissions, including contingent commissions for
placing profitable business with carrier partners, reinsurance commissions, and loss mitigation fees. Underwriting
Management provides retail and wholesale brokers specialty market expertise in distinct and complex market niches
underserved in today’s marketplace through MGUs, which act on behalf of insurance carriers that have given the Company
the authority to underwrite and bind coverage for specific risks in a cost-effective manner, and programs that offer
commercial and personal insurance for specific product lines or industry classes.
Contract Balances
Contract assets, which arise primarily from the Company’s supplemental and contingent commission arrangements,
medical stop loss business, and multi-year structured solutions business, are included within Commissions and fees
receivable – net on the Consolidated Balance Sheets. These assets relate to the unbilled amounts of services for which the
Company recognizes revenue over time. Payment related to contract assets is typically due within one year of the
completed performance obligation. Occasionally, the Company receives cash payments from customers in advance of the
Company’s performance obligation being satisfied, which represent a contract liability and are included within Accounts
payable and accrued liabilities on the Consolidated Balance Sheets. Contract liabilities are recognized as revenue when the
performance obligations are satisfied.
Cash and Cash Equivalents
Cash and cash equivalents include cash in demand deposit accounts and short-term investments, consisting principally of
AAA-rated money market funds and treasury bills, having original maturities of 90 days or less. Interest income is
recognized in Interest expense, net on the Consolidated Statements of Income.
Commissions and Fees Receivable
The Company earns commissions and fees through its Wholesale Brokerage, Binding Authority, and Underwriting
Management Specialties. The Company records a receivable once a performance obligation is satisfied. In some instances,
the Company advances premiums on behalf of clients, or advances claims payments and refunds to clients on behalf of
underwriters. These amounts are reflected within Commissions and fees receivable – net on the Consolidated Balance
Sheets.
The Company’s receivables are shown net of an allowance for expected credit losses, which is estimated based on a
combination of factors, including evaluation of historical write-offs, current economic conditions, aging of balances, and
other qualitative and quantitative analyses.
Fiduciary Assets, Fiduciary Liabilities, and Related Income
In its role as an insurance intermediary, the Company collects and remits amounts between insurance agents and brokers
and insurance underwriters. Because these amounts are collected on behalf of third parties, they are excluded from the
measurement of the transaction price. Similarly, the Company elected to exclude surplus lines taxes from the measurement
of the transaction price, as these are assessed by and remitted to governmental authorities. The Company recognizes
fiduciary amounts collectible and held on behalf of others, including insurance policyholders, clients, other insurance
intermediaries, and insurance carriers, as Fiduciary cash and receivables on the Consolidated Balance Sheets. Cash and
cash equivalents held in excess of the amount required to meet the Company’s fiduciary obligations are recognized as Cash
and cash equivalents on the Consolidated Balance Sheets. The Company recognizes premiums, claims payable, and surplus
lines taxes as Fiduciary liabilities on the Consolidated Balance Sheets. The Company does not have any rights or
obligations in connection with these amounts with the exception of segregating these amounts from the Company’s
operating accounts and liabilities.
92
Unremitted insurance premiums are held in a fiduciary capacity until disbursement. The Company holds these funds in
cash and, where permitted, cash equivalents, including AAA-rated money market funds registered with the U.S. Securities
and Exchange Commission under Rule 2a-7 of the Investment Company Act of 1940. Interest income is earned on the
unremitted funds, which is included in Fiduciary investment income in the Consolidated Statements of Income. Interest
earned on fiduciary funds held is not accounted for under ASC 606, Revenue from Contracts with Customers.
Goodwill and Intangible Assets
Goodwill
Goodwill represents the excess of consideration transferred over the fair value of the net assets acquired in the acquisition
of a business. The Company recognizes goodwill as the amount of consideration transferred which cannot be assigned to
other tangible or intangible assets and liabilities.
The Company reviews goodwill for impairment at least annually, and whenever events or changes in circumstances
indicate that the carrying value of the reporting unit may not be recoverable. In the performance of the annual evaluation,
the Company also considers qualitative and quantitative developments between the date of the goodwill impairment review
and the fiscal year end to determine if an impairment should be recognized.
The Company reviews goodwill for impairment at the reporting unit level, which coincides with the operating segment,
Ryan Specialty. The determinations of impairment indicators and the fair value of the reporting unit are based on estimates
and assumptions related to the amount and timing of future cash flows and future interest rates. Such estimates and
assumptions could change in the future as more information becomes available, which could impact the amounts reported
and disclosed herein.
Intangible Assets
Intangible assets consist primarily of customer relationships. Customer relationships are amortized over their estimated
useful lives, ranging from one to fifteen years, in proportion with the realization of their economic benefit. Generally, the
Company uses outside valuation specialists to value acquired intangible assets. Other intangible assets include trade names,
internally developed software, and assembled workforces, which are amortized over their estimated useful lives, typically
one to three years, four to seven years, and five years, respectively. The Company has no indefinite-lived intangible assets.
Equity Method Investments
The Company uses the equity method to account for equity investments for which the Company has the ability to exercise
significant influence, but not control, over the investee’s operating and financial policies. Equity method investments are
initially recorded at cost and subsequently adjusted to recognize the Company’s proportionate share of the investee’s net
income or loss. The Company’s proportionate share of the other comprehensive income or loss from equity method
investments is reflected on the Consolidated Statements of Comprehensive Income. Intra-entity profits or losses arising
from transactions with equity method investees are eliminated in proportion with the Company’s ownership interest until
realized by the investee. The eliminations are recognized through Equity method investments on the Consolidated Balance
Sheets and Income from equity method investments on the Consolidated Statements of Income. The Company may incur
certain expenses on behalf of its investees, which are recognized within Income from equity method investments on the
Consolidated Statements of Income. The Company’s equity method investments are evaluated for impairment whenever
events or changes in circumstances indicate that the carrying value of the assets may not be recoverable. If the impairment
is determined to be other-than-temporary, the Company will recognize an impairment loss equal to the difference between
the expected realizable value and the carrying value of the investment.
Leases
The Company evaluates contracts entered into to determine whether the contract involves the use of an asset. The
Company then evaluates whether it controls the use of the asset, which is determined by assessing whether it obtains
substantially all economic benefits from the use of the asset, and whether it has the right to direct the use of the asset. If
these criteria are met and a lease has been identified, the Company accounts for the contract under the requirements of ASC
842, Leases.
The Company’s leased assets consist primarily of real estate for occupied offices and office equipment. Certain of these
leases have options permitting renewals for additional periods or clauses allowing for early termination, and where those
are reasonably certain to be executed, they are recognized as a component of the initial lease term. All of the Company’s
93
real estate leases and office equipment leases are recognized as operating leases. The Company also subleases some real
estate properties to third parties, which are classified as operating leases. The Company recognizes lease payments for
short-term leases of twelve months or less on a straight-line basis over the lease term in the Consolidated Statements of
Income.
For leases in which an implicit rate is not provided in the contract, the Company uses an incremental borrowing rate based
on the information available at the lease commencement date in determining the present value of lease payments. The
Company does not account for separate lease components of a contract and its associated non-lease components as a single
lease component. Further, variable expenses related to real estate and office equipment leases are expensed as incurred.
At the lease commencement for operating leases, the Company recognizes the total lease liability through the lease term as
the present value of all remaining payments, discounted by the rate determined at commencement. Operating leases are
included in Lease right-of-use assets, Current Operating lease liabilities, and Non-current Operating lease liabilities on the
Consolidated Balance Sheets. In the event the lease liability is remeasured due to a change in the scope of, or the
consideration for, a lease, an adjustment is made to the right-of-use asset. If a right-of-use asset is impaired, the impairment
charge is recognized within General and administrative expense on the Consolidated Statements of Income.
Equity-Based Compensation
The Company issues equity-based awards to employees in the form of Restricted Stock, Restricted Stock Units (“RSUs”),
Performance Stock Units (“PSUs”), Stock Options, Restricted Common Units, Restricted LLC Units (“RLUs”),
Performance LLC Units (“PLUs”), and Class C Incentive Units. Compensation expense for equity awards is measured at
the grant date fair value. The grant date fair value of Restricted Stock and RSUs is based on the closing price of the
underlying stock the day prior to issuance. The grant date fair value of RLUs is valued consistently to RSUs less a discount
for the lower distributions that they are entitled to accrue. The grant date fair value of Stock Options is estimated using the
Black-Scholes option pricing model, and the grant date fair value of PSUs, PLUs, Restricted Common Units and Class C
Incentive Units is estimated using a Monte Carlo simulation based pricing model. These pricing models require
management to make assumptions with respect to the fair value of the equity awards on the grant date, including the
expected term of the award, the expected volatility of the Company’s stock based on a period of time generally
commensurate with the expected term of the award, risk-free interest rates, and expected dividend yields of the Company’s
Class A common stock, among other items including the Company’s Class A common stock price and taxable income
forecasts. These assumptions reflect the Company’s best estimates, but they involve inherent uncertainties based on market
conditions generally outside the control of the Company. As a result, if other assumptions are used, compensation expense
could be materially impacted.
The Company accounts for equity-based compensation in accordance with ASC 718, Compensation- Stock Compensation
(“ASC 718”). In accordance with ASC 718, compensation expense is measured at the estimated grant date fair value of the
equity-based awards and is expensed over the vesting period during which an employee provides service in exchange for
the award. Compensation expense is recognized using the graded vesting attribution method and forfeitures are accounted
for as they occur. For performance-based awards, the Company assesses the probability of achieving the relevant
performance metrics each reporting period. If the Company determines that it is no longer probable that a performance
metric will be achieved, the expense previously recognized for the related awards is reversed. Equity-based compensation
expense is recorded in Compensation and benefits on the Consolidated Statements of Income. See Note 10, Equity-Based
Compensation, for additional information on the Company’s equity-based compensation awards.
Earnings Per Share
Basic earnings per share is computed by dividing net earnings attributable to Ryan Specialty Holdings, Inc. by the number
of weighted-average shares of Class A common stock outstanding during the period. Diluted earnings per share is
computed by dividing net earnings attributable to Ryan Specialty Holdings, Inc. by the number of weighted-average shares
of Class A common stock outstanding during the period after adjusting for the impact of securities that would have a
dilutive effect on earnings per share. See Note 11, Earnings Per Share, for additional information on dilutive securities.
Derivative Instruments and Hedging Activities
The Company generally uses derivative financial instruments to manage the risk profile of existing underlying exposures,
including changes in interest rates and foreign currency exchange rates. For cash flow hedges, the Company assesses
effectiveness both at inception and on an on-going basis. For hedging derivatives that qualify as effective cash flow hedges,
the Company records the cumulative changes in the fair value of the financial instrument in Other comprehensive income
(loss) (“OCI”). Amounts recorded in OCI are reclassified into earnings in the periods in which earnings are affected by the
94
hedged cash flow. If a derivative is not designated as an accounting hedge, such as forward contracts periodically used by
the Company to limit foreign currency exchange rate exposure, the change in fair value is recorded in earnings. The
Company utilized an interest rate cap for interest rate risk management purposes. The Company amortized the premium
paid for the interest rate cap on a straight-line basis over the life of the instrument. The premium amortization was
recognized in Interest expense, net on the Consolidated Statements of Income. The Company recognizes cash flows related
to designated and non-designated hedges in the same section of the Consolidated Statement of Cash Flows as the cash
flows related to the item being hedged. The Company does not hold or issue derivative instruments for trading or
speculative purposes. See Note 12, Derivatives, for further discussion of derivative financial instruments.
Defined Contribution Plan
The Company offers a defined contribution retirement benefit plan, the Ryan Specialty Employee Savings Plan (the
“Savings Plan”), to all eligible U.S. employees, based on a minimum number of service hours in a year. Under the Savings
Plan, eligible employees may contribute a percentage of their compensation, subject to certain limitations. Further, the
Savings Plan authorizes the Company to make a discretionary matching contribution, which has historically equaled 50%
of each eligible employee’s contribution. The Company makes discretionary matching contributions throughout the year
and recognizes expense for the matching contribution in the period where requisite employee service is performed. The
Company recognized expense related to discretionary matching contributions of $31.0 million, $25.3 million, and $21.3
million for the years ended December 31, 2025, 2024, and 2023, respectively, which was included in Compensation and
benefits on the Consolidated Statements of Income.
Deferred Compensation Plan
The Company offers a non-qualified deferred compensation plan to certain senior employees and members of management.
Under this plan, amounts deferred remain assets of the Company and are subject to the claims of the Company’s creditors
in the event of insolvency. Amounts deferred are not invested in any funds. However, the liability balance is updated to
reflect hypothetical interest, earnings, appreciation, losses, and depreciation that would be accrued or realized if the
deferred compensation amounts had been invested in the applicable benchmark investments. Changes in the value of
deferred amounts held are recognized within Compensation and benefits in the Consolidated Statements of Income. The
Company recognized liabilities for employee deferrals, inclusive of changes in the value of deferred amounts held, of $8.0
million and $5.2 million in Current Accrued compensation as of December 31, 2025 and 2024, respectively, and $50.8
million and $36.5 million in Non-current Accrued compensation on the Consolidated Balance Sheets as of December 31,
2025 and 2024, respectively.
Non-Controlling Interests
As noted above, the Company consolidates the financial results of the LLC; therefore, it reports non-controlling interests
based on the LLC Common Units not owned by the Company on the Consolidated Balance Sheets. Net income and OCI
are attributed to the non-controlling interests based on the weighted-average LLC Common Units outstanding during the
period. Net income attributable to the non-controlling interests is presented on the Consolidated Statements of Income.
Refer to Note 9, Stockholders’ Equity, for more information.
The non-controlling interest holders may, subject to certain exceptions, exchange some or all of their LLC Common Units
for newly-issued shares of Class A common stock on a one-for-one basis, or for cash, at the Company’s election
(determined by a majority of the Company’s directors who are disinterested) and only to the extent that the Company has
received cash proceeds pursuant to a secondary offering. As any redemption settled in cash would be limited to proceeds
received from the sale of new permanent equity securities, the Non-controlling interests are classified as permanent equity
on the Consolidated Balance Sheets.
Captive Insurance Cells
Through acquisitions, the Company has an ownership interest in three entities that hold segregated account protected cell
captives. These entities are structured with protected cell captives for each insured (“Captive Cells”) and the core regulated
companies (“Core Companies”). The Core Companies are owned and operated by the Company, and are not exposed to the
insurance and investment risks that the Captive Cells are designed to create and distribute on behalf of the insureds. The
Company has a variable interest in the Core Companies due to its ownership interests, however, as the Core Companies are
not exposed to the variability of the Captive Cells, only the activity of the regulated Core Companies is recorded in the
Company’s consolidated financial statements, including cash and any expenses incurred to operate the Captive Cells.
95
Litigation and Contingent Liabilities
The Company is subject to various legal actions related to claims, lawsuits, and proceedings incident to the nature of the
business. The Company records liabilities for loss contingencies when it is probable that a liability has been incurred on or
before the balance sheet date and the amount of the liability can be reasonably estimated. The Company does not discount
such contingent liabilities and recognizes related legal costs, such as fees and expenses of external counsel and other
service providers, as period expenses when incurred. Loss contingencies are recorded within Accounts payable and accrued
liabilities on the Consolidated Balance Sheets. Significant management judgment is required to estimate the amounts of
such contingent liabilities. The Company records loss recoveries from E&O insurance coverage, up to the amount of the
financial statement loss incurred, when the realization of the indemnity for a claim presented under the Company’s E&O
insurance coverage is deemed probable in Other current assets on the Consolidated Balance Sheets. In order to assess
potential liabilities and any recoveries, the Company analyzes the litigation exposure based upon available information,
including consultation with counsel handling the defense of these matters. As these liabilities are uncertain by their nature,
the recorded amounts may change due to a variety of factors, including new developments or changes in the approach, such
as changing the settlement strategy as applicable to a matter.
Foreign Currency Translation
The Company assigns functional currencies to its foreign operations, which are generally the currencies of the local
operating environment. Balances denominated in non-functional currency are remeasured to the functional currency using
current exchange rates, and the resulting foreign exchange gains or losses are reflected in earnings. Functional currency
balances are then translated into the reporting currency (i.e., USD) using (i) exchange rates at the balance sheet date for
items reported as assets or liabilities on the Consolidated Balance Sheets, (ii) historical rates for items reported in the
Consolidated Statements of Stockholders’ Equity other than retained earnings, and (iii) average exchange rates for items
recorded in earnings and included in retained earnings. The resulting change in unrealized translation gains or losses is a
component of Accumulated other comprehensive income on the Consolidated Balance Sheets.
Income Taxes
The Company accounts for income taxes under the asset and liability method. Deferred tax assets and liabilities are
recognized for the future tax consequences attributable to differences between the financial statement carrying values of
existing assets and liabilities and their respective tax bases. Deferred tax assets and liabilities are measured using enacted
tax rates in effect for the year in which those temporary differences are expected to be recovered or settled. The effect of a
change in tax rates on deferred tax assets and deferred tax liabilities is recognized in income in the period that includes the
enactment date.
The Company recognizes deferred tax assets to the extent that it is believed that these assets are more likely than not to be
realized. In making such a determination, the Company considers all available positive and negative evidence, including
future reversals of existing taxable temporary differences, projected future taxable income, tax-planning strategies,
carryback potential if permitted under the tax law, and results of recent operations. A valuation allowance is provided if it
is determined that it is more likely than not that the deferred tax asset will not be realized.
The Company evaluates and accounts for uncertain tax positions in accordance with ASC 740, Income Taxes, using a two-
step approach. Recognition (step one) occurs when the Company concludes that a tax position, based solely on its technical
merits, is more likely than not to be sustainable upon examination. Measurement (step two) determines the amount of tax
benefit that is greater than 50% likely to be realized upon ultimate settlement with a taxing authority that has full
knowledge of all relevant information. Derecognition of a tax position that was previously recognized would occur if the
Company subsequently determines that a tax position no longer meets the more likely than not threshold of being
sustained. The Company records interest, and penalties where applicable, net of any applicable related income tax benefit,
on potential income tax contingencies as a component of Income tax expense on the Consolidated Statements of Income.
Holders of the LLC Common Units, including the Company, incur U.S. federal, state, and local income taxes on their share
of any taxable income of the LLC. The LLC Operating Agreement provides for pro rata cash distributions (“Members’ Tax
Distributions”) to the holders of the LLC Common Units in an amount generally calculated to provide each holder of LLC
Common Units with sufficient cash to cover their tax liability in respect of the LLC Common Units. In general, these
Members’ Tax Distributions are computed based on the LLC’s estimated taxable income, multiplied by an assumed tax rate
as set forth in the LLC Operating Agreement.
96
Tax Receivable Agreement (TRA)
The Company is party to a TRA with current and certain former LLC Unitholders. The TRA provides for the payment by
the Company to the current and certain former LLC Unitholders of 85% of the amount of net cash savings, if any, in U.S.
federal, state, and local income taxes the Company actually realizes (or under certain circumstances are deemed to realize)
from (i) certain increases in the tax basis of the assets of the LLC resulting from purchases or exchanges of LLC Common
Units (“Exchange Tax Attributes”), (ii) certain tax attributes of the LLC that existed prior to the IPO (“Pre-IPO M&A Tax
Attributes”), (iii) certain favorable “remedial” partnership tax allocations to which the Company becomes entitled (if any),
and (iv) certain other tax benefits related to the Company entering into the TRA, including tax benefits attributable to
payments that the Company makes under the TRA (“TRA Payment Tax Attributes”).
The Company accounts for amounts payable under the TRA in accordance with ASC 450, Contingencies. The amounts
payable under the TRA will vary depending upon a number of factors, including the timing of exchanges by the LLC
Unitholders, the amount of gain recognized by the LLC Unitholders, the amount and timing of the taxable income the
Company generates in the future, and the federal tax rates then applicable. Actual tax benefits realized by the Company
may differ from tax benefits calculated under the TRA as a result of the use of certain assumptions in the agreement. Any
such changes in these factors or changes in the Company’s determination of the need for a valuation allowance related to
the tax benefits acquired under the TRA could adjust the Tax Receivable Agreement liabilities recognized on the
Consolidated Balance Sheets.
The Company accounts for the effects of the increases in tax basis and associated liabilities under the TRA arising from
exchanges with respect to Exchange Tax Attributes and TRA Payment Tax Attributes (i) by recording an increase in
deferred tax assets for the estimated income tax effects of the increases in tax basis based on the enacted federal and state
tax rates at the date of the exchange, (ii) to the extent it is estimated that the Company will not realize the full benefit
represented by the deferred tax asset, based on an analysis that will consider, among other things, our expectation of future
earnings, by reducing the deferred tax asset with a valuation allowance, and (iii) by recording an offsetting increase in the
Tax Receivable Agreement liability for 85% of the realizable tax benefit and an increase in Additional paid-in capital for
the remaining 15% of the realizable tax benefit on the Consolidated Balance Sheets.
The Company accounts for the associated liability under the TRA arising from exchanges with respect to the Pre-IPO
M&A Tax Attributes by recording an increase in the Tax Receivable Agreement liability for 85% of the realizable tax
benefits associated with the Pre-IPO M&A Tax Attributes with an offsetting decrease to Additional paid-in capital on the
Consolidated Balance Sheets.
Subsequent changes to the initial establishment of the increases in deferred tax assets and Tax Receivable Agreement
liability between reporting periods will be recognized in the Consolidated Statements of Stockholders’ Equity as the
exchanges represent transactions among shareholders. Subsequent changes in the fair value of the Tax Receivable
Agreement liabilities between reporting periods, as well as any interest accrued on the TRA between the Company’s annual
tax filing date and the TRA payment date, are recognized in the Consolidated Statements of Income. In the unlikely event
of an early termination of the TRA, either due to Company default or a change of control, the Company is required to pay
to each holder of the TRA an early termination payment equal to the discounted present value of all unpaid TRA payments.
Recently Issued Accounting Pronouncements
New Accounting Pronouncements Recently Adopted
In December 2023, the FASB issued ASU 2023-09 Income Taxes (Topic 740) — Improvements to Income Tax Disclosures,
which includes amendments that enhance income tax disclosures, primarily through standardization and the disaggregation
of rate reconciliation categories and income taxes paid by jurisdiction. This ASU is effective for annual reporting periods
beginning after December 15, 2024. The amendments in this ASU should be applied on a prospective basis, however,
retrospective application is permitted. The Company adopted this ASU retrospectively as of December 31, 2025. See Note
17, Income Taxes, for the resulting incremental disclosures related to the Company’s income taxes.
In July 2025, the FASB issued ASU 2025-05 Financial Instruments — Credit Losses (Topic 326) — Measurement of
Credit Losses for Accounts Receivable and Contract Assets, which provides a practical expedient permitting entities to
assume that current conditions as of the balance sheet date do not change for the remaining life of current accounts
receivables and contract assets when estimating expected credit losses. This ASU is effective for annual reporting periods
beginning after December 15, 2025, and interim reporting periods within those annual reporting periods, with early
97
adoption permitted. The Company early adopted this ASU prospectively in the third quarter of 2025, with no material
impact to the consolidated financial statements or disclosures.
In November 2025, the FASB issued ASU 2025-09 Derivatives and Hedging (Topic 815) — Hedge Accounting
Improvements, which includes amendments to better align hedge accounting with the economics of an entity’s risk
management activities by allowing entities to achieve and sustain hedge accounting for highly effective economic hedges
of forecasted transactions. This ASU is effective for annual reporting periods beginning after December 15, 2026, and
interim periods within those annual reporting periods, with early adoption permitted. The Company early adopted this ASU
as of December 31, 2025, and will apply it prospectively to new hedging relationships.
Recently Issued Accounting Pronouncements Not Yet Adopted
In November 2024, the FASB issued ASU 2024-03 Income Statement — Reporting Comprehensive Income — Expense
Disaggregation Disclosures (Subtopic 220-40) — Disaggregation of Income Statement Expenses, which requires the
disaggregation of certain expense captions into specified categories in disclosures within the footnotes to the financial
statements. This ASU is effective for annual reporting periods beginning after December 15, 2026, and interim periods
within fiscal years beginning after December 15, 2027, with early adoption permitted. The amendments in this ASU may
be applied either prospectively or retrospectively. The Company is currently evaluating the impact of adopting this ASU on
its disclosures.
In September 2025, the FASB issued ASU 2025-06 Intangibles — Goodwill and Other — Internal-Use Software (Subtopic
350-40) — Targeted Improvements to the Accounting for Internal-Use Software, which removes all references to
prescriptive and sequential software development stages and instead requires entities to begin capitalizing costs once
management has authorized and committed to funding the software, and it is probable that the project will be completed
and used to perform its intended functions. Significant uncertainty regarding development activities must be assessed when
evaluating if a project is probable to be completed. Additionally, the ASU clarifies certain disclosure requirements for
capitalized internal-use software costs. This ASU is effective for annual reporting periods beginning after December 15,
2027, and interim reporting periods within those annual reporting periods, with early adoption permitted. The amendments
in this ASU may be applied prospectively, using a modified transition approach, or retrospectively. The Company is
currently evaluating the impact of adopting this ASU on its consolidated financial statements and disclosures.
In December 2025, the FASB issued ASU 2025-11 Interim Reporting (Topic 270) — Narrow-Scope Improvements, which
includes amendments that clarify when the interim reporting guidance is applicable, outlines the interim disclosures
required under this guidance and all other ASC topics, and establishes a disclosure principle that requires an entity to
disclose material events that have occurred since the last annual reporting period. This ASU is effective for interim
reporting periods within annual reporting periods beginning after December 15, 2027, with early adoption permitted. The
amendments in this ASU may be applied prospectively or retrospectively. The Company is currently evaluating the impact
of adopting this ASU on its consolidated financial statements and disclosures.
In December 2025, the FASB issued ASU 2025-12 Codification Improvements, which includes amendments that provide
clarification, correct technical errors, and make minor improvements with the intent to make the Accounting Standard
Codification easier to understand and apply. This ASU is effective for annual reporting periods beginning after December
15, 2026, and interim periods within those annual reporting periods, with early adoption permitted. The amendments in this
ASU may be applied prospectively or retrospectively. The Company is currently evaluating the impact of adopting this
ASU on its consolidated financial statements and disclosures.
Recent Tax Legislation
On July 4, 2025, the One Big Beautiful Bill Act (“OBBBA”), which includes a broad range of tax reform provisions, such
as the provision allowing accelerated tax deductions for qualified property and research expenditures, was signed into law
in the United States. OBBBA did not have a material impact on the Company’s consolidated financial statements or
disclosures for the year ended December 31, 2025.
98
3. REVENUE FROM CONTRACTS WITH CUSTOMERS
Disaggregation of Revenue
The following table summarizes revenue from contracts with customers by Specialty:
Year Ended December 31, | ||||||
2025 | 2024 | 2023 | ||||
Wholesale Brokerage | $1,600,427 | $1,489,077 | $1,319,056 | |||
Binding Authority | 370,155 | 320,379 | 275,961 | |||
Underwriting Management | 1,024,000 | 646,215 | 431,579 | |||
Total Net commissions and fees | $2,994,582 | $2,455,671 | $2,026,596 | |||
Contract Balances
The contract assets balance, which is included within Commissions and fees receivable – net on the Consolidated Balance
Sheets, was $65.4 million and $35.6 million as of December 31, 2025 and 2024, respectively. The contract liability balance
related to deferred revenue, which is included in Accounts payable and accrued liabilities on the Consolidated Balance
Sheets, was $10.0 million and $8.7 million as of December 31, 2025 and 2024, respectively. During the year ended
December 31, 2025, $8.6 million of the contract liabilities outstanding as of December 31, 2024, were recognized as
revenue.
4. MERGERS AND ACQUISITIONS
2025 Acquisitions
On February 3, 2025, the Company completed the acquisition of Velocity Risk Underwriters, LLC (“Velocity”), an MGU
specializing in first-party insurance coverage for catastrophe exposed properties, headquartered in Nashville, Tennessee,
for cash consideration of $549.6 million and contingent consideration of $19.6 million. Measurement period adjustments
related to the initial valuation of contingent consideration of $1.5 million, Other current assets of $1.5 million, and net
working capital of $0.9 million were recognized as a net $0.9 million increase in Goodwill on the Consolidated Balance
Sheets as of December 31, 2025.
On May 1, 2025, the Company completed the acquisition of certain assets of USQRisk Holdings, LLC (“USQ”), a
company based in New York, New York, and London, England, that underwrites, structures, prices, and places specialty
insurance for corporate clients seeking bespoke, multi-year risk solutions, for cash consideration of $28.9 million and
contingent consideration of $23.8 million. A measurement period adjustment related to net working capital of $0.2 million
was recognized as an increase in Goodwill on the Consolidated Balance Sheets as of December 31, 2025.
On May 16, 2025, the Company completed the acquisition of 360° Underwriting (“360”), an MGU specializing in
commercial construction, based in Dublin and Galway, Ireland, for cash consideration of $28.2 million and contingent
consideration of $0.6 million.
On July 1, 2025, the Company completed the acquisition of certain assets of J.M. Wilson Corporation (“JM Wilson”), a
binding authority and surplus lines broker specializing in transportation insurance, headquartered in Portage, Michigan, for
$67.2 million of cash consideration and $20.4 million of LLC Common Units. Measurement period adjustments related to
Commissions and fees receivable – net of $0.8 million, the initial valuation of Customer relationships of $0.4 million, and
net working capital of $0.6 million were recognized as a net $0.6 million increase in Goodwill on the Consolidated Balance
Sheets as of December 31, 2025.
On December 1, 2025, the Company completed the acquisition of Stewart Specialty Risk Underwriting Ltd. (“SSRU”), an
MGU specializing in underwriting large-account, high-hazard property and casualty solutions, based in Toronto, Canada,
for $124.3 million of cash consideration and $8.1 million of RYAN Class A common stock.
The $44.1 million of contingent consideration liabilities established for the above acquisitions were measured at the
estimated acquisition date fair value and were non-cash investing transactions. The contingent consideration liabilities are
based on the individual businesses’ revenue or EBITDA targets, or both, over periods generally ranging from two to five
years following the date of acquisition.
99
The following table summarizes the estimated fair values of the aggregate assets and liabilities acquired, inclusive of
measurement period adjustments, during the year ended December 31, 2025:
Velocity | USQ | 360 | JM Wilson | SSRU | Total | |||||||
Cash and cash equivalents | $17,736 | $— | $548 | $— | $8,200 | $26,484 | ||||||
Commissions and fees receivable – net | 23,650 | 13,124 | 571 | 2,887 | 3,293 | 43,525 | ||||||
Fiduciary cash and receivables | 105,779 | 1,649 | 4,221 | 22,032 | 19,574 | 153,255 | ||||||
Goodwill | 366,249 | 20,759 | 16,847 | 47,871 | 84,844 | 536,570 | ||||||
Customer relationships1 | 216,400 | 19,100 | 12,303 | 39,500 | 51,354 | 338,657 | ||||||
Other intangible assets | 12,000 | 200 | 67 | 300 | 787 | 13,354 | ||||||
Property and equipment – net | — | — | — | 494 | 1,397 | 1,891 | ||||||
Lease right-of-use assets | 3,757 | 612 | — | 305 | 1,338 | 6,012 | ||||||
Other current and non-current assets | 2,862 | 101 | 82 | 131 | 148 | 3,324 | ||||||
Total assets acquired | $748,433 | $55,545 | $34,639 | $113,520 | $170,935 | $1,123,072 | ||||||
Accounts payable and accrued liabilities | 5,305 | 193 | — | 389 | 2,527 | 8,414 | ||||||
Accrued compensation | 7,129 | 373 | 43 | 231 | 1,030 | 8,806 | ||||||
Fiduciary liabilities | 105,779 | 1,649 | 4,221 | 25,018 | 19,574 | 156,241 | ||||||
Operating lease liabilities | 3,757 | 612 | — | 305 | 1,338 | 6,012 | ||||||
Deferred tax liabilities | 57,298 | — | 1,546 | — | 14,025 | 72,869 | ||||||
Total liabilities assumed | $179,268 | $2,827 | $5,810 | $25,943 | $38,494 | $252,342 | ||||||
Net assets acquired | $569,165 | $52,718 | $28,829 | $87,577 | $132,441 | $870,730 |
1 The acquired customer relationships have a weighted-average amortization period of 13.3 years.
Estimates and assumptions used in the acquisition valuations are subject to change within the measurement period up to
one year from each acquisition date. The Company recognized acquisition-related expenses, which include advisory, legal,
accounting, valuation, and diligence-related costs, for the acquisitions above of $15.3 million during the year ended
December 31, 2025, in General and administrative expense on the Consolidated Statements of Income. The Company
recognized an aggregate $109.5 million of revenue related to the 2025 acquisitions above from their respective acquisition
dates during the year ended December 31, 2025. Estimated tax deductible goodwill of $42.1 million was generated as a
result of these acquisitions.
2024 Acquisitions
On May 1, 2024, the Company completed the acquisition of Castel Underwriting Agencies Limited (“Castel”), a managing
general underwriting platform headquartered in London, England, for cash consideration of $247.6 million, $2.2 million of
RYAN Class A common stock, and contingently returnable consideration of $4.9 million. During the year ended
December 31, 2024, measurement period adjustments related to Deferred tax liabilities of $1.6 million, taxes payable of
$0.9 million, and working capital of $0.5 million were recognized as a net $2.0 million decrease in Goodwill on the
Consolidated Balance Sheets.
On August 30, 2024, the Company completed the acquisition of US Assure Insurance Services of Florida, Inc. (“US
Assure”), a program specializing in builder’s risk insurance headquartered in Jacksonville, Florida, for cash consideration
of $1,079.8 million and contingent consideration of $103.8 million. During the year ended December 31, 2024, a
measurement period adjustment related to working capital of $5.2 million was recognized as an increase in Goodwill on the
Consolidated Balance Sheets.
On September 1, 2024, the Company completed the acquisition of certain assets of Greenhill Underwriting Insurance
Services, LLC, an MGU focused on the allied health industry headquartered in Houston, Texas, for cash consideration of
$11.7 million. During the year ended December 31, 2024, measurement period adjustments related to working capital of
$0.4 million and the initial valuation of Customer relationships of $0.1 million were recognized as a net $0.3 million
increase in Goodwill on the Consolidated Balance Sheets.
On September 13, 2024, the Company completed the acquisition of the Property and Casualty (“P&C”) MGUs owned by
Ethos Specialty Insurance, LLC (“Ethos P&C”) for cash consideration of $44.0 million. Ethos P&C is composed of eight
programs which underwrite on behalf of insurance carriers.
100
On October 1, 2024, the Company completed the acquisition of certain assets of EverSports & Entertainment Insurance,
Inc., an MGU focused on sports, leisure, and entertainment headquartered in Carmel, Indiana, for $43.1 million of cash
consideration. Total consideration for this acquisition also included contingent consideration, however, the contingent
consideration value was de minimis as of the acquisition date. A measurement period adjustment related to Commissions
and fees receivable – net of $1.6 million was recognized as an increase in Goodwill on the Consolidated Balance Sheets as
of December 31, 2025.
On November 4, 2024, the Company completed the acquisition of Innovisk Capital Partners (“Innovisk”), which is
composed of seven specialty MGUs headquartered in London, England, for cash consideration of $426.8 million.
Measurement period adjustments related to Current Accrued compensation of $2.2 million, Deferred tax assets of $2.2
million, and Commissions and fees receivable – net of $4.7 million were recognized as increases in Goodwill on the
Consolidated Balance Sheets as of December 31, 2025.
The Company recognized acquisition-related expenses, which include advisory, legal, accounting, valuation, and diligence-
related costs, for the 2024 acquisitions of $19.1 million during the year ended December 31, 2024, in General and
administrative expense on the Consolidated Statements of Income. The Company recognized an aggregate $102.8 million
of revenue related to the 2024 acquisitions from their respective acquisition dates during the year ended December 31,
2024. Estimated tax deductible goodwill of $735.8 million was generated as a result of these acquisitions. In conjunction
with the closing of the Castel acquisition, the deal-contingent foreign currency forward (the “Deal-Contingent Forward”),
as described in Note 12, Derivatives, was settled.
2023 Acquisitions
On January 3, 2023, the Company completed the acquisition of certain assets of Griffin Underwriting Services, a binding
authority specialist and wholesale insurance broker headquartered in Bellevue, Washington, for cash consideration of
$115.5 million.
On July 1, 2023, the Company completed the acquisitions of certain assets of ACE Benefit Partners, Inc., a medical stop
loss general agent headquartered in Eagle, Idaho, and Point6 Healthcare, LLC, a distributor of medical stop loss insurance
on behalf of retail brokers and third-party administrators headquartered in Plano, Texas, for an aggregate $46.8 million of
cash consideration and $2.3 million of contingent consideration. During the year ended December 31, 2024, a measurement
period adjustment related to the initial valuation of contingent consideration of $0.6 million was recognized as an increase
in Goodwill on the Consolidated Balance Sheets.
On July 3, 2023, the Company completed the acquisition of Socius Insurance Services (“Socius”), a national wholesale
insurance broker headquartered in Northern California, for $253.5 million of cash consideration, $5.8 million of contingent
consideration, and $2.7 million of RYAN Class A common stock.
On December 1, 2023, the Company completed the acquisition of AccuRisk Holdings, LLC (“AccuRisk”), a medical stop
loss managing general underwriter headquartered in Chicago, Illinois, for $98.3 million of cash consideration. During the
year ended December 31, 2024, measurement period adjustments related to the initial valuation of contingent consideration
of $0.3 million and Deferred tax assets of $0.4 million were recognized as increases in Goodwill on the Consolidated
Balance Sheets.
The Company recognized acquisition-related expenses, which include advisory, legal, accounting, valuation, and diligence-
related costs, for the 2023 acquisitions of $7.1 million during the year ended December 31, 2023, in General and
administrative expense on the Consolidated Statements of Income. The Company recognized an aggregate $47.2 million of
revenue related to the 2023 acquisitions from their respective acquisition dates during the year ended December 31, 2023.
Unaudited Pro Forma Financial Information
The following unaudited pro forma financial information presents the combined results of operations of the Company as if
the 2025 acquisitions occurred on January 1, 2024, the 2024 acquisitions occurred on January 1, 2023, and the 2023
acquisitions occurred on January 1, 2022. The unaudited pro forma financial information is presented for informational
purposes only and is not indicative of the results of operations that would have been achieved if the acquisitions had taken
place on the dates indicated or of results that may occur in the future. The pre-acquisition Castel and US Assure results
101
included in the pro forma figures below contain acquisition-related expenses that were not considered pro forma
adjustments for the Company.
Year Ended December 31, | ||||||
2025 | 2024 | 2023 | ||||
Total revenue | $3,089,163 | $2,802,256 | $2,410,956 | |||
Net income | 276,189 | 14,715 | 68,743 | |||
The unaudited pro forma financial information includes adjustments related to incremental amortization expense on
acquired intangible assets, transaction costs, incremental income tax expense related to CCRs (as defined in Note 17,
Income Taxes), and the consequential tax effects of the pro forma adjustments. The unaudited pro forma financial
information also includes an adjustment for incremental financing costs and interest expense resulting from the debt
activity related to the US Assure and Innovisk acquisitions of $20.6 million and $99.0 million for the years ended
December 31, 2024 and 2023, respectively.
Contingent Consideration
Total consideration for certain acquisitions includes contingent consideration or contingently returnable consideration,
which is generally based on the EBITDA or revenue of the acquired business following a defined period after purchase.
Further information regarding fair value measurements of contingent consideration and contingently returnable
consideration is detailed in Note 14, Fair Value Measurements. The Company recognizes income or loss for the changes in
fair value of estimated contingent consideration and contingently returnable consideration within Change in contingent
consideration, and recognizes accretion of the discount on these assets or liabilities within Interest expense, net, on the
Consolidated Statements of Income. The table below summarizes the amounts recognized:
Year Ended December 31, | ||||||
2025 | 2024 | 2023 | ||||
Change in contingent consideration | $13,122 | $(22,859) | $5,421 | |||
Interest expense, net | 8,090 | 5,472 | 3,052 | |||
Total | $21,212 | $(17,387) | $8,473 | |||
As of December 31, 2025, the aggregate amount of maximum consideration related to acquisitions was $597.4 million of
contingent consideration and $13.5 million of contingently returnable consideration.
5. RECEIVABLES AND OTHER CURRENT ASSETS
Receivables
The Company had receivables of $489.0 million and $389.8 million outstanding as of December 31, 2025 and 2024,
respectively, which were recognized within Commissions and fees receivable – net on the Consolidated Balance Sheets.
Commission and fees receivable is net of an allowance for expected credit losses. The Company’s allowance for expected
credit losses is based on a combination of factors, including evaluation of historical write-offs, current economic
conditions, aging of balances, and other qualitative and quantitative analyses.
The following table provides a summary of changes in the Company’s allowance for expected credit losses:
Year Ended December 31, | ||||
2025 | 2024 | |||
Balance at beginning of period | $3,018 | $2,458 | ||
Write-offs | (4,908) | (3,106) | ||
Increase in provision | 5,985 | 3,666 | ||
Balance at end of period | $4,095 | $3,018 | ||
102
Other Current Assets
Major classes of other current assets consisted of the following:
As of December 31, | ||||
2025 | 2024 | |||
Prepaid expenses | $62,995 | $51,701 | ||
Insurance recoverable | — | 20,155 | ||
Interest rate cap | — | 13,936 | ||
Other current receivables | 37,442 | 24,159 | ||
Total Other current assets | $100,437 | $109,951 | ||
Other current receivables contain service receivables from Geneva Re, Ltd (“Geneva Re”) and Velocity Specialty
Insurance Company (“VSIC”). See Note 16, Related Parties, for further information regarding related parties. See Note 15,
Commitments and Contingencies, for further information on the insurance recoverable. See Note 12, Derivatives, for
further information on the interest rate cap.
6. GOODWILL AND OTHER INTANGIBLE ASSETS
The following table provides a summary of goodwill activity:
Year Ended December 31, | ||||
2025 | 2024 | |||
Balance at beginning of period | $2,646,676 | $1,646,482 | ||
Acquisitions1 | 537,647 | 999,763 | ||
Measurement period adjustments | 13,316 | 4,744 | ||
Impact of exchange rate changes | 27,382 | (4,313) | ||
Balance at end of period | $3,225,021 | $2,646,676 | ||
1 For the year ended December 31, 2025, the activity includes goodwill recognized from immaterial acquisitions not
disclosed in Note 4, Mergers and Acquisitions.
The net carrying amounts of finite-lived intangible assets are shown in the table below:
As of December 31, 2025 | As of December 31, 2024 | |||||||||||
Cost | Accumulated Amortization | Net Carrying Amount | Cost | Accumulated Amortization | Net Carrying Amount | |||||||
Customer relationships | $2,460,456 | $(963,571) | $1,496,885 | $2,102,404 | $(710,356) | $1,392,048 | ||||||
Internally developed software | 157,503 | (45,055) | 112,448 | 103,388 | (27,051) | 76,337 | ||||||
Other1 | 37,977 | (30,804) | 7,173 | 32,538 | (25,201) | 7,337 | ||||||
Total | $2,655,936 | $(1,039,430) | $1,616,506 | $2,238,330 | $(762,608) | $1,475,722 | ||||||
1 Other consists of trade names and assembled workforces.
The cost of internally developed software in development but not yet placed in service was $46.7 million and $30.8 million
as of December 31, 2025 and 2024, respectively.
103
The aggregate amortization expense from finite-lived intangible assets was $274.4 million, $157.8 million, and $106.8
million for the years ended December 31, 2025, 2024, and 2023, respectively. The estimated future amortization for finite-
lived intangible assets as of December 31, 2025, was as follows:
Customer Relationships | Internally Developed Software | Other | ||||
2026 | $234,372 | $21,624 | $3,480 | |||
2027 | 203,398 | 26,804 | 2,255 | |||
2028 | 180,609 | 24,950 | 723 | |||
2029 | 159,891 | 18,392 | 477 | |||
2030 | 141,603 | 13,194 | 238 | |||
Thereafter | 577,012 | 7,484 | — | |||
Total | $1,496,885 | $112,448 | $7,173 |
7. LEASES
The Company has operating leases with various terms through September 2038, primarily for office space and office
equipment. The following table provides additional information about the Company’s leases:
Year Ended December 31, | ||||||
2025 | 2024 | 2023 | ||||
Lease costs | ||||||
Operating lease costs | $35,547 | $31,375 | $36,907 | |||
Short-term lease costs | ||||||
Operating lease costs | 1,550 | 1,000 | 870 | |||
Sublease income | (600) | (514) | (642) | |||
Lease costs – net | $36,497 | $31,861 | $37,135 | |||
Cash paid for amounts included in the measurement of lease liabilities | ||||||
Operating cash flows used for operating leases | $34,638 | $32,351 | $32,933 | |||
Non-cash related activities | ||||||
Right-of-use assets obtained in exchange for new operating lease liabilities | 23,692 | 31,487 | 11,771 | |||
Amortization of right-of-use assets for operating leases | 26,658 | 22,460 | 24,664 | |||
Weighted-average discount rate (percent) | ||||||
Operating leases | 5.4% | 5.4% | 5.1% | |||
Weighted-average remaining lease term (years) | ||||||
Operating leases | 6.8 | 7.6 | 8.2 | |||
104
The estimated future minimum payments of operating leases as of December 31, 2025, were as follows:
2026 | $34,969 | |
2027 | 35,726 | |
2028 | 30,182 | |
2029 | 27,860 | |
2030 | 26,163 | |
Thereafter | 61,770 | |
Total undiscounted future lease payments | $216,670 | |
Less: Imputed interest | (37,594) | |
Present value lease liabilities | $179,076 |
The Company had three leases with inception dates prior to December 31, 2025, that had not yet commenced as of
December 31, 2025, for total future estimated lease liabilities of $5.2 million.
105
8. DEBT
Substantially all of the Company’s debt is carried at outstanding principal balance, less debt issuance costs and any
unamortized discount. The following table is a summary of the Company’s outstanding debt:
As of December 31, | ||||
2025 | 2024 | |||
Term debt | ||||
7-year term loan facility, periodic interest and quarterly principal payments, Adjusted Term SOFR + 2.00% as of December 31, 2025, Adjusted Term SOFR + 2.25% as of December 31, 2024, matures September 13, 2031 | $1,659,629 | $1,672,532 | ||
Senior secured notes | ||||
8-year senior secured notes, semi-annual interest payments, 4.38%, mature February 1, 2030 | 402,677 | 401,676 | ||
8-year senior secured notes, semi-annual interest payments, 5.88%, mature August 1, 2032 | 1,209,908 | 1,198,183 | ||
Revolving debt | ||||
5-year revolving loan facility, periodic interest payments, Adjusted Term SOFR + up to 2.50%, plus commitment fees of 0.25%-0.50%, matures July 30, 2029 | 74,062 | 1,207 | ||
Premium financing notes | ||||
Commercial notes, periodic interest and principal payments, 5.25%, expire May 1, 2026 | 2,519 | — | ||
Commercial notes, periodic interest and principal payments, 5.25%, expire June 1, 2026 | 499 | — | ||
Commercial notes, periodic interest and principal payments, 5.25%, expire June 21, 2026 | 2,355 | — | ||
Commercial notes, periodic interest and principal payments, 6.25%, expired May 1, 2025 | — | 2,673 | ||
Commercial notes, periodic interest and principal payments, 6.25%, expired June 1, 2025 | — | 548 | ||
Commercial notes, periodic interest and principal payments, 6.25%, expired June 21, 2025 | — | 2,642 | ||
Units subject to mandatory redemption | — | 3,399 | ||
Total debt | $3,351,649 | $3,282,860 | ||
Less: Short-term debt and current portion of long-term debt | (60,187) | (51,732) | ||
Long-term debt | $3,291,462 | $3,231,128 | ||
The future maturities of long-term debt, which excludes premium financing notes, as of December 31, 2025, were as
follows:
2026 | $54,814 | |
2027 | 17,000 | |
2028 | 17,000 | |
2029 | 90,182 | |
2030 | 17,000 | |
Thereafter | 3,198,000 | |
Total repayments | $3,393,996 | |
Less: Unamortized discounts and debt issuance costs | (47,720) | |
Total | $3,346,276 |
106
Term Loan
In September 2024, the Term Loan principal increased from $1,650.0 million to $1,700.0 million. In August 2025,
Moody’s Ratings upgraded the Company’s credit rating from B1 to Ba3. As a result, the applicable interest rate on the
Company’s Term Loan decreased from Adjusted Term SOFR + 2.25% to Adjusted Term SOFR + 2.00%. As of
December 31, 2025, $1,683.0 million of the principal was outstanding, $0.3 million of interest was accrued, and the related
unamortized deferred issuance costs were $23.6 million. As of December 31, 2024, $1,700.0 million of the principal was
outstanding, $0.3 million of interest was accrued, and the related unamortized deferred issuance costs were $27.8 million.
Revolving Credit Facility
The Revolving Credit Facility had a borrowing capacity of $1,400.0 million as of December 31, 2025 and 2024. Due to the
nature of the instrument, the deferred issuance costs related to the facility of $7.5 million and $9.6 million as of
December 31, 2025 and 2024, respectively, were included in Other non-current assets on the Consolidated Balance Sheets.
The commitments available to be borrowed under the Revolving Credit Facility were $1,326.8 million as of December 31,
2025, as the facility was drawn on by $73.2 million. The commitments available to be borrowed under the Revolving
Credit Facility were $1,399.7 million as of December 31, 2024, as the facility was reduced by $0.3 million of undrawn
letters of credit.
The Company pays a commitment fee on undrawn amounts under the facility of 0.25% - 0.50%. As of December 31, 2025
and 2024, the Company accrued $0.8 million and $1.2 million, respectively, of unpaid commitment fees related to the
Revolving Credit Facility in Short-term debt and current portion of long-term debt on the Consolidated Balance Sheets. As
of December 31, 2025, accrued interest on the facility was $0.1 million.
Borrowings under the Term Loan and the Revolving Credit Facility are secured by a first-priority lien and security interest
in substantially all of the assets, subject to certain exceptions, of existing and future material domestic subsidiaries of the
Company.
Senior Secured Notes due 2030
In February 2022, the LLC issued $400.0 million of Senior Secured Notes. As of December 31, 2025 and 2024, accrued
interest on the notes was $7.3 million, and the related unamortized deferred issuance costs were $4.6 million and $5.6
million, respectively.
Senior Secured Notes due 2032
In September 2024, the LLC issued $600.0 million of Senior Secured Notes at par. In December 2024, the LLC issued an
additional $600.0 million of Senior Secured Notes at a price of 99.5% of their face value plus accrued interest from
September 19, 2024. The notes issued in December 2024 were issued as additional notes under the same indenture as the
notes that were issued in September 2024 and, as such, form a single series and trade interchangeably with the previously
issued senior secured notes due 2032. As of December 31, 2025 and 2024, accrued interest on the notes was $29.4 million
and $20.0 million, respectively, and the related unamortized deferred issuance costs, including discount, were $19.5 million
and $21.8 million, respectively.
Subsidiary Units Subject to Mandatory Redemption
On December 29, 2025, Ryan Re Underwriting Managers, LLC (“Ryan Re”) settled its outstanding preferred units, which
were held by the Ryan Parties, and as a result, there were no longer units outstanding as of December 31, 2025. During the
year ended December 31, 2025, the Company made payments of $3.7 million to the Ryan Parties related to the units, which
consisted of return of the initial investment and accrued return. As the units were originally due June 13, 2034, and were
mandatorily redeemable, they were classified as Long-term debt on the Consolidated Balance Sheets as of December 31,
2024. The historical cost of the units was $3.3 million, which was valued using an implicit rate of 9.8%. Accretion of the
discount using the implicit rate was recognized within Interest expense, net on the Consolidated Statements of Income. See
Note 16, Related Parties, for further information on Ryan Re.
9. STOCKHOLDERS’ EQUITY
Ryan Specialty’s amended and restated certificate of incorporation authorizes the issuance of up to 1,000,000,000 shares of
Class A common stock, 1,000,000,000 shares of Class B common stock, and 500,000,000 shares of preferred stock, each
having a par value of $0.001 per share.
107
The New LLC Operating Agreement requires that the Company and the LLC at all times maintain a one-to-one ratio
between the number of shares of Class A common stock issued by the Company and the number of LLC Common Units
owned by the Company, except as otherwise determined by the Company.
Class A and Class B Common Stock
Each share of Class A common stock is entitled to one vote per share. Each share of Class B common stock is entitled to 10
votes per share but, upon the occurrence of certain events as set forth in the Company’s amended and restated certificate of
incorporation, or as of September 30, 2029, at the latest, each share will be entitled to one vote per share in the future. All
holders of Class A common stock and Class B common stock vote together as a single class except as otherwise required
by applicable law or our amended and restated certificate of incorporation. Holders of Class B common stock do not have
any right to receive dividends or distributions upon the liquidation or winding up of the Company.
In accordance with the New LLC Operating Agreement, the LLC Unitholders are entitled to exchange LLC Common Units
for shares of Class A common stock, or, at the Company’s election, for cash from a substantially concurrent public offering
or private sale (based on the price of our Class A common stock in such public offering or private sale). The LLC
Unitholders are also required to deliver to the Company an equivalent number of shares of Class B common stock to
effectuate such an exchange. Any shares of Class B common stock so delivered will be canceled. Shares of Class B
common stock are not issued for Class C Incentive Units that are exchanged for LLC Common Units as these LLC
Common Units are immediately exchanged for Class A common stock as discussed in Note 10, Equity-Based
Compensation.
Class X Common Stock
During the year ended December 31, 2025, the Company amended and restated its certificate of incorporation to, among
other changes, eliminate Class X common stock and, as such, it is no longer authorized to be issued. As of December 31,
2024, there were 10,000,000 shares of Class X common stock authorized. However, there were no shares of Class X
common stock outstanding as of December 31, 2025 or 2024. Shares of Class X common stock had no economic, voting,
or dividend rights.
Preferred Stock
There were no shares of preferred stock outstanding as of December 31, 2025 or 2024. Under the terms of the amended and
restated certificate of incorporation, the Board is authorized to direct the Company to issue shares of preferred stock in one
or more series without stockholder approval. The Board has the discretion to determine the rights, preferences, privileges,
and restrictions, including voting rights, dividend rights, conversion rights, redemption privileges, and liquidation
preferences, of each series of preferred stock.
Dividends
During the year ended December 31, 2025, the Company’s Board of Directors declared a regular quarterly cash dividend of
$0.12 per share on the Company’s outstanding Class A common stock. During the year ended December 31, 2025, $61.0
million of dividends were paid on Class A common stock.
Non-controlling Interests
The Company is the sole managing member of the LLC. As a result, the Company consolidates the LLC in its consolidated
financial statements, resulting in non-controlling interests related to the LLC Common Units not held by the Company. As
of December 31, 2025 and 2024, the Company owned 49.1% and 47.9%, respectively, of the economic interests in the
LLC, while the non-controlling interest holders owned the remaining 50.9% and 52.1%, respectively, of the economic
interests in the LLC.
Weighted-average ownership percentages for the applicable reporting periods are used to attribute net income and OCI to
the Company and the non-controlling interest holders. The non-controlling interest holders’ weighted-average ownership
percentage was 51.5%, 52.0%, and 56.1% for the years ended December 31, 2025, 2024, and 2023, respectively.
During the year ended December 31, 2025, the Company declared a regular quarterly cash distribution of $0.05 per unit on
the LLC’s outstanding LLC Common Units. During the year ended December 31, 2025, $27.1 million in distributions were
paid to the non-controlling interest holders of the LLC Common Units
108
10. EQUITY-BASED COMPENSATION
The Ryan Specialty Holdings, Inc. 2021 Omnibus Incentive Plan (the “Omnibus Plan”) governs, among other things, the
types of awards the Company can grant to employees as equity-based compensation awards. The Omnibus Plan provides
for potential grants of the following awards: (i) stock options, (ii) stock appreciation rights, (iii) restricted stock awards,
(iv) performance awards, (v) other stock-based awards, (vi) other cash-based awards, and (vii) analogous equity awards
made in equity of the LLC.
IPO-Related Awards
As a result of the Organizational Transactions, pre-IPO holders of LLC Units that were granted as incentive awards, which
had historically been classified as equity and vested pro rata over five years, were required to exchange their LLC Units for
either Restricted Stock or Restricted Common Units. Additionally, Reload Options or Reload Class C Incentive Units were
issued to employees in order to protect against the dilution of their existing awards upon exchange to the new awards.
Separately, certain employees were granted one or more of the following new awards: (i) RSUs, (ii) Staking Options, (iii)
RLUs, or (iv) Staking Class C Incentive Units. The terms of these awards are described below. All awards granted as part
of the Organizational Transactions and the IPO are subject to non-linear transfer restrictions for at least the five-year period
following the IPO.
Incentive Awards
As part of the Company’s annual compensation process, the Company issues certain employees and directors equity-based
compensation awards (“Incentive Awards”). Additionally, the Company offers Incentive Awards to certain new hires.
These Incentive Awards typically take the form of (i) RSUs, (ii) RLUs, (iii) Class C Incentive Units, (iv) Stock Options,
(v) PSUs, and (vi) PLUs. The terms of these awards are described below.
Restricted Stock and Restricted Common Units
As part of the Organizational Transactions, certain existing employee unitholders were granted Restricted Stock or
Restricted Common Units in exchange for their LLC Units. The Restricted Stock and Restricted Common Units followed
the vesting schedule of the LLC Units for which they were exchanged. LLC Units historically vested pro rata over 5 years.
Year Ended December 31, 2025 | ||||||||
Restricted Stock | Weighted Average Grant Date Fair Value | Restricted Common Units | Weighted Average Grant Date Fair Value | |||||
Unvested at beginning of period | 413,820 | $21.15 | 135,991 | $23.84 | ||||
Granted | — | — | — | — | ||||
Vested | (412,587) | 21.15 | (135,991) | 23.84 | ||||
Forfeited | (1,233) | 21.15 | — | — | ||||
Unvested at end of period | — | $— | — | $— | ||||
109
Restricted Stock Units (RSUs)
IPO RSUs
Related to the IPO, the Company granted RSUs to certain employees. The IPO RSUs vest either pro rata over 5 years from
the grant date or over 10 years from the grant date, with 10% vesting in each of years 3 through 9 and 30% vesting in year
10.
Incentive RSUs
Incentive RSUs vest either 100% 3 or 5 years from the grant date, pro rata over 3 or 5 years from the grant date, over 5
years from the grant date, with one-third of the grant vesting in each of years 3, 4 and 5, or over 7 years from the grant
date, with 20% vesting in each of years 3 through 7.
Upon vesting, RSUs automatically convert on a one-for-one basis into Class A common stock.
Year Ended December 31, 2025 | ||||||||
IPO RSUs | Incentive RSUs | |||||||
Restricted Stock Units | Weighted Average Grant Date Fair Value | Restricted Stock Units | Weighted Average Grant Date Fair Value | |||||
Unvested at beginning of period | 2,699,966 | $23.14 | 2,374,687 | $43.33 | ||||
Granted | — | — | 711,997 | 64.97 | ||||
Vested | (588,054) | 22.83 | (461,648) | 41.44 | ||||
Forfeited | (64,951) | 23.29 | (71,595) | 50.87 | ||||
Unvested at end of period | 2,046,961 | $23.22 | 2,553,441 | $49.49 | ||||
The weighted-average grant date fair value of Incentive RSUs granted during the years ended December 31, 2024 and
2023, was $53.39 and $41.37, respectively. The fair value of RSUs vested during the years ended December 31, 2025,
2024, and 2023, was $71.6 million, $46.2 million, and $19.8 million, respectively.
Stock Options
Reload and Staking Options
As part of the Organizational Transactions and IPO, certain employees were granted Reload Options or Staking Options
that entitle the award holder to future purchases of Class A common stock, on a one-for-one basis, at the IPO price of
$23.50. The Reload Options either vested 100% 3 years from the grant date or vest over 5 years from the grant date, with
one-third of the grant vesting in each of years 3, 4 and 5. In general, vested Reload Options are exercisable up to the tenth
anniversary of the grant date. The Staking Options vest over 10 years from the grant date, with 10% vesting in each of
years 3 through 9 and 30% vesting in year 10. Staking Options are exercisable up to one year after their vest date.
Incentive Options
Incentive Options entitle the award holder to future purchases of Class A common stock, on a one-for-one basis, at the
respective exercise prices. The Incentive Options vest either over 5 years from the grant date, with one-third of the grant
110
vesting in each of years 3, 4 and 5 or pro rata over 7 years from the grant date. In general, vested Incentive Options are
exercisable up to the tenth anniversary of the grant date.
Year Ended December 31, 2025 | ||||||||
Reload Options1 | Staking Options1 | Incentive Options | Incentive Options Weighted Average Exercise Price | |||||
Outstanding at beginning of period | 3,870,764 | 66,667 | 281,652 | $43.97 | ||||
Granted | — | — | — | — | ||||
Exercised | (424,600) | — | (8,999) | 34.39 | ||||
Forfeited or expired | (52,838) | — | (1,406) | 34.39 | ||||
Outstanding at end of period | 3,393,326 | 66,667 | 271,247 | $44.34 | ||||
1 As the Reload and Staking Options were one-time grants at the IPO, the weighted-average exercise price for any
movements in these awards will perpetually be $23.50. As such, the values are not presented in the table above.
The fair value of Incentive Options granted during the year ended December 31, 2024, was determined using the Black-
Scholes option pricing model with the following assumptions:
Volatility | 25.0% | |
Time to maturity (years) | 7.0 | |
Risk-free rate | 4.2% | |
Dividend yield | 0.8% | |
Fair value per option | $17.09 |
There were no Incentive Options granted during the years ended December 31, 2025 or 2023.
The use of a valuation model for Options requires management to make certain assumptions with respect to selected model
inputs. Expected volatility was calculated based on the observed volatility for comparable companies. The expected time to
maturity was based on the weighted-average vesting term and contractual term of the awards. The risk-free interest rate
was based on U.S. Treasury rates commensurate with the expected life of the awards. The dividend yield was based on the
Company’s expected dividend rate.
As of December 31, 2025, there were 2,273,330, 13,332, and 56,915, exercisable Reload, Staking, and Incentive Options,
respectively. The aggregate intrinsic values and weighted-average remaining contractual terms of Stock Options
outstanding and exercisable as of December 31, 2025, were as follows:
Aggregate intrinsic value ($ in thousands): | ||
Reload Options outstanding | $95,454 | |
Reload Options exercisable | 63,949 | |
Staking Options outstanding | 1,875 | |
Staking Options exercisable | 375 | |
Incentive Options outstanding | 2,090 | |
Incentive Options exercisable | 612 | |
Weighted-average remaining contractual term (in years): | ||
Reload Options outstanding | 5.3 | |
Reload Options exercisable | 5.3 | |
Staking Options outstanding | 3.9 | |
Staking Options exercisable | 0.5 | |
Incentive Options outstanding | 4.6 | |
Incentive Options exercisable | 4.0 |
111
Restricted LLC Units (RLUs)
IPO RLUs
Related to the IPO, the Company granted RLUs to certain employees that vest either pro rata over 5 years from the grant
date or over 10 years from the grant date, with 10% vesting in each of years 3 through 9 and 30% vesting in year 10.
Incentive RLUs
Incentive RLUs vest either 100% 3 years from the grant date, pro rata over 3 or 5 years from the grant date, or over 7 years
from the grant date, with 20% vesting in each of years 3 through 7.
Upon vesting, RLUs convert on a one-for-one basis into either LLC Common Units or Class A common stock at the
election of the Company.
Year Ended December 31, 2025 | ||||||||
IPO RLUs | Incentive RLUs | |||||||
Restricted LLC Units | Weighted Average Grant Date Fair Value | Restricted LLC Units | Weighted Average Grant Date Fair Value | |||||
Unvested at beginning of period | 1,293,538 | $25.10 | 686,712 | $44.30 | ||||
Granted | — | — | — | — | ||||
Vested | (154,592) | 25.05 | (48,064) | 36.44 | ||||
Forfeited | — | — | — | — | ||||
Unvested at end of period | 1,138,946 | $25.10 | 638,648 | $44.89 | ||||
The weighted-average grant date fair value of Incentive RLUs granted during the years ended December 31, 2024 and
2023, was $51.33 and $41.14, respectively.
Class C Incentive Units
Reload and Staking Class C Incentive Units
As part of the Organizational Transactions and IPO, certain employees were granted Reload Class C Incentive Units or
Staking Class C Incentive Units, which are profits interests. When the value of Class A common stock exceeds the
participation threshold, vested profits interests may be exchanged for LLC Common Units of equal value. On exchange,
the LLC Common Units are immediately redeemed on a one-for-one basis for Class A common stock. The Reload Class C
Incentive Units either vested 100% 3 years from the grant date or vest over 5 years from the grant date, with one-third of
the grant vesting in each of years 3, 4 and 5. The Staking Class C Incentive Units vest either pro rata over 5 years from the
grant date or over 10 years from the grant date, with 10% vesting in each of years 3 through 9 and 30% vesting in year 10.
Class C Incentive Units
Class C Incentive Units are profits interests. When the value of Class A common stock exceeds the participation threshold,
vested profits interests may be exchanged for LLC Common Units of equal value. On exchange, the LLC Common Units
are immediately redeemed on a one-for-one basis for Class A common stock. The Class C Incentive Units vest over 8 years
from the grant date, with 15% vesting in each of years 3 through 7 and 25% vesting in year 8, or over 7 years from the
grant date, with 20% vesting in each of years 3 through 7.
112
Year Ended December 31, 2025 | ||||||||
Reload Class C Incentive Units | Staking Class C Incentive Units | Class C Incentive Units | Class C Incentive Units Weighted Average Participation Threshold | |||||
Unvested at beginning of period | 952,595 | 1,605,003 | 495,822 | $36.80 | ||||
Granted | — | — | — | — | ||||
Vested | (494,763) | (271,667) | (45,000) | 34.13 | ||||
Forfeited | — | — | — | — | ||||
Unvested at end of period | 457,832 | 1,333,336 | 450,822 | $36.86 | ||||
As the Reload and Staking Class C Incentive Units were one-time grants at the IPO, the weighted-average participation
threshold for these awards will be consistent across any type of movement. The weighted-average participation threshold
for Reload and Staking Class C Incentive Units was $23.14 and $23.34 as of December 31, 2025 and 2024, respectively.
The decrease in the participation thresholds for the various types of Class C Incentive Units was due to the distributions
declared with respect to these awards during the year ended December 31, 2025.
Valuation Considerations
LLC Common Units are exchangeable into shares of Class A common stock of the Company on a one-to-one basis, which
entitles the unitholders to TRA payments resulting from 85% of the tax savings generated by the Company. The various
Class C Incentive Units have the same terms as the LLC Common Units, with the exception of their respective
participation thresholds. When the price of the Class A common stock exceeds the participation threshold, the Class C
Incentive Units can be exchanged for LLC Common Units of equal value and are entitled to the same TRA benefits upon
an exchange to Class A common stock. In order to value the Class C Incentive Units, the Company is required to make
certain assumptions with respect to select model inputs.
Due to the nature of the underlying risks inherent in TRA payments and the uncertainty as to when the participation
threshold will be satisfied for the various Class C Incentive Units, the Company uses a Monte Carlo simulation to explicitly
model the impact of future stock prices on the size of the amortizable asset, as well as the impact of different levels of
taxable income on the timing of the TRA payments, in a risk-neutral framework. For Class C Incentive Units granted
during the year ended December 31, 2023, the Monte Carlo simulation model used the following assumptions: the
simulated closing stock price, the simulated taxable income, the risk-free interest rate, the expected dividend yield, and the
expected volatility and correlation of the Company’s stock price and taxable income. The dividend yield was based on the
Company’s expected dividend rate at the time of 0.0%. The risk-free interest rate of 4.0% was based on U.S. Treasury rates
commensurate with a term of 30 years. The weighted-average grant date fair value of Class C Incentive Units granted
during the year ended December 31, 2023, was $22.98. There were no Class C Incentive Units granted during the years
ended December 31, 2025 or 2024.
Performance Based Awards
Performance Stock Units (PSUs) and Performance LLC Units (PLUs)
Performance-based equity awards, PSUs and PLUs, are subject to the achievement of several defined performance and
market metrics. All performance awards are subject to a total shareholder return (“TSR”) compound annual growth rate
(“CAGR”) target and one or more of the following metrics: (i) an Adjusted EBITDAC margin target, (ii) an Organic
revenue CAGR target, or (iii) an individual revenue target. The TSR CAGR is calculated from the base price, as outlined in
the respective grant agreements, to the volume weighted-average price (“VWAP”) of Class A common stock for the period
specified by the grant agreement plus dividends paid to Class A common shareholders. A minimum threshold for the TSR
CAGR, as well as the targets for the other metrics, as applicable, must all be met in order for the awards to vest.
In general, the PSUs and PLUs vest 5 years from the grant date. PSUs represent the right to receive Class A common
shares and PLUs represent the right to receive LLC Common Units upon vesting. If the minimum threshold of the TSR
CAGR is achieved, and the other required targets are achieved, the TSR CAGR target and, if applicable, the individual
revenue target, will determine how many Class A common shares or LLC Common Units, as applicable, the awards vest
into. Assuming at least the minimum thresholds are met, the awards will vest into between 75% and 150% of the applicable
target stock or units, which will be calculated on a graduated basis. Confirmation of the targets will not occur until after
113
earnings are reported for the final fiscal year in the award’s performance period. The probability of achieving the
performance metrics is assessed each reporting period for expense purposes. During the year ended December 31, 2025, it
was determined that the Adjusted EBITDAC margin target for the executive PSUs and PLUs granted in fiscal year 2024
was not probable of being achieved and, as a result, the expense previously recognized for these awards was reversed.
Year Ended December 31, 2025 | ||||||||
PSUs | PLUs | |||||||
Performance Stock Units | Weighted Average Grant Date Fair Value | Performance LLC Units | Weighted Average Grant Date Fair Value | |||||
Unvested at beginning of period | 366,996 | $27.99 | 487,218 | $24.40 | ||||
Granted | 1,367,329 | 27.46 | — | — | ||||
Vested | — | — | — | — | ||||
Forfeited | (121,405) | 25.45 | — | — | ||||
Unvested at end of period | 1,612,920 | $27.73 | 487,218 | $24.40 | ||||
The grant date fair values of the performance-based awards were determined using the Monte Carlo simulation valuation
model with the following assumptions:
Year Ended December 31, | ||||
2025 | 2024 | |||
Volatility | 23.6% - 25.4% | 22.1% - 24.7% | ||
Time to maturity (years) | 4.7 - 4.8 | 3.4 - 4.1 | ||
Risk-free rate | 3.8% - 4.0% | 4.1% - 4.2% | ||
RYAN stock price at valuation date | $67.66 - $69.47 | $52.38 - $66.71 | ||
The use of a valuation model for the PSUs and PLUs requires management to make certain assumptions with respect to
selected model inputs. Expected volatility was calculated based on the observed volatility for comparable companies. The
time to maturity was based on the stock price CAGR target through the end of the performance period. The risk-free
interest rate was based on U.S. Treasury rates commensurate with the performance period. The valuation also considers the
difference in Dividend Equivalents and Declared Distributions (as defined below) that PSUs and PLUs are entitled to
accrue. The weighted-average grant date fair values of PSUs and PLUs granted during the year ended December 31, 2024,
were $27.99 and $24.40, respectively.
Non-Employee Director Stock Grants
The Company grants RSUs to non-employee directors serving as members of the Company’s Board of Directors (“Director
Stock Grants”), with the exception of the one director who has agreed to forgo any compensation for their service to the
Board. The Director Stock Grants are fully vested upon grant. During the years ended December 31, 2025, 2024, and 2023,
the Company granted 23,230, 22,935, and 19,698 Director Stock Grants, respectively, with weighted-average grant date
fair values of $69.94, $49.07, and $40.86, respectively.
Dividend Equivalents and Declared Distributions
A majority of the Company’s unvested equity-based compensation awards, with the exception of Options and Class C
Incentive Units, are entitled to accrue dividend equivalents if the award vests into Class A common stock (“Dividend
Equivalents”) or declared distributions if the award vests into LLC Common Units (“Declared Distributions”) over the
period the underlying award vests. The Dividend Equivalents and Declared Distributions will be paid in cash to award
holders at the time the underlying award vests. If an award holder forfeits their underlying award, the accrued Dividend
Equivalents or Declared Distributions will also be forfeit. Class C Incentive Units do not accrue cash distributions but
instead have their participation thresholds lowered by each Declared Distribution. Options do not participate in dividends.
As of December 31, 2025, the Company accrued $1.1 million and $0.1 million related to Dividend Equivalents and
Declared Distributions, respectively, in Accounts payable and accrued liabilities, and $4.3 million and $0.6 million related
to Dividend Equivalents and Declared Distributions, respectively, in Other non-current liabilities on the Consolidated
Balance Sheets. As of December 31, 2024, the Company accrued $0.9 million and $0.1 million related to Dividend
114
Equivalents and Declared Distributions, respectively, in Accounts payable and accrued liabilities, and $2.9 million and $0.4
million related to Dividend Equivalents and Declared Distributions, respectively, in Other non-current liabilities on the
Consolidated Balance Sheets.
Equity-Based Compensation Expense
As of December 31, 2025, the unrecognized equity-based compensation expense and the related weighted-average
remaining expense period, as applicable, related to the types of equity-based compensation awards described above were as
follows:
Amount | Weighted Average Remaining Expense Period (Years) | |||
IPO RSUs | $17,973 | 4.2 | ||
Incentive RSUs | 66,118 | 2.8 | ||
Reload Options | 219 | 0.6 | ||
Incentive Options | 154 | 1.0 | ||
PSUs | 30,760 | 4.2 | ||
IPO RLUs | 12,364 | 4.3 | ||
Incentive RLUs | 11,635 | 2.3 | ||
Reload Class C Incentive Units | 149 | 0.6 | ||
Staking Class C Incentive Units | 3,638 | 4.2 | ||
Class C Incentive Units | 3,509 | 3.0 | ||
Total unrecognized equity-based compensation expense | $146,519 |
The following table includes the equity-based compensation the Company recognized by award type from the view of
expense related to pre-IPO and post-IPO awards.
Recognized | |||||
Year Ended December 31, | |||||
2025 | 2024 | 2023 | |||
IPO awards | |||||
IPO RSUs and Staking Options | $8,041 | $11,522 | $15,760 | ||
IPO RLUs and Staking Class C Incentive Units | 9,849 | 9,284 | 11,424 | ||
Incremental Restricted Stock and Reload Options | 1,100 | 2,820 | 4,332 | ||
Incremental Restricted Common Units and Reload Class C Incentive Units | 798 | 3,328 | 7,119 | ||
Pre-IPO incentive awards | |||||
Restricted Stock | 440 | 1,473 | 2,387 | ||
Restricted Common Units | 137 | 5,170 | 1,454 | ||
Post-IPO incentive awards | |||||
Incentive RSUs | 33,092 | 29,769 | 19,245 | ||
Incentive RLUs | 7,644 | 7,728 | 4,567 | ||
Incentive Options | 2,058 | 974 | 466 | ||
Class C Incentive Units | 1,854 | 2,072 | 1,906 | ||
PSUs | 4,542 | 1,407 | — | ||
PLUs | (2,058) | 2,058 | — | ||
Other expense | |||||
Director Stock Grants | 1,954 | 1,390 | 1,083 | ||
Total equity-based compensation expense | $69,451 | $78,995 | $69,743 | ||
115
11. EARNINGS PER SHARE
Basic earnings per share is computed by dividing net income attributable to Ryan Specialty Holdings, Inc. by the weighted-
average number of shares of Class A common stock outstanding during the period. Diluted earnings per share is computed
giving effect to potentially dilutive shares, including LLC equity awards and the non-controlling interests’ LLC Common
Units that are exchangeable into Class A common stock. As shares of Class B common stock do not share in earnings and
are not participating securities, they are not included in the Company’s calculation. A reconciliation of the numerator and
denominator used in the calculation of basic and diluted earnings per share of Class A common stock is as follows:
Year Ended December 31, | ||||||
2025 | 2024 | 2023 | ||||
Net income | $214,157 | $229,913 | $194,480 | |||
Less: Net income attributable to non-controlling interests | 150,758 | 135,248 | 133,443 | |||
Net income attributable to Ryan Specialty Holdings, Inc. | $63,399 | $94,665 | $61,037 | |||
Numerator: | ||||||
Net income attributable to Class A common shareholders | $63,399 | $94,665 | $61,037 | |||
Add (less): Income attributed to substantively vested RSUs | — | — | (10) | |||
Net income attributable to Class A common shareholders – basic | $63,399 | $94,665 | $61,027 | |||
Add: Income attributed to dilutive shares | 926 | 255 | 4,185 | |||
Net income attributable to Class A common shareholders – diluted | $64,325 | $94,920 | $65,212 | |||
Denominator: | ||||||
Weighted-average shares of Class A common stock outstanding – basic | 127,266,889 | 120,781,234 | 114,359,968 | |||
Add: Dilutive shares | 10,979,525 | 12,110,253 | 11,385,171 | |||
Weighted-average shares of Class A common stock outstanding – diluted | 138,246,414 | 132,891,487 | 125,745,139 | |||
Earnings per share | ||||||
Earnings per share of Class A common stock – basic | $0.50 | $0.78 | $0.53 | |||
Earnings per share of Class A common stock – diluted | $0.47 | $0.71 | $0.52 | |||
The following numbers of shares were excluded from the calculation of diluted earnings per share because the effect of
including such potentially dilutive shares would have been antidilutive:
Year Ended December 31, | ||||||
2025 | 2024 | 2023 | ||||
Conversion of non-controlling interest LLC Common Units1 | 135,429,254 | 138,979,885 | 142,383,621 | |||
Conversion of vested Class C Incentive Units1 | — | — | 76,397 | |||
Class C Incentive Units | — | — | 495,822 | |||
1 Weighted-average units outstanding during the period.
12. DERIVATIVES
Deal-Contingent Foreign Currency Forward
In December 2023, the Company entered into the Deal-Contingent Forward to manage the risk of appreciation of the GBP-
denominated purchase price of the acquisition of Castel. The Deal-Contingent Forward had a 200.0 million GBP notional
amount and was executed when the Castel acquisition closed on May 1, 2024. As the Deal-Contingent Forward was an
economic hedge and had not been designated as an accounting hedge, losses resulting from the Deal-Contingent Forward
were recognized through earnings in the periods incurred.
Interest Rate Cap
In April 2022, the Company entered into an interest rate cap agreement to manage its exposure to interest rate fluctuations
related to the Company’s Term Loan in the amount of $25.5 million. The interest rate cap had a $1,000.0 million notional
116
amount, 2.75% strike, and terminated on December 31, 2025. At inception, the Company formally designated the interest
rate cap as a cash flow hedge, which remained effective through the instrument’s termination date.
For the years ended December 31, 2025, 2024, and 2023, decreases of $13.9 million, $15.7 million, and $16.2 million,
respectively, in the fair value of the interest rate cap were recognized in OCI. See Note 17, Income Taxes, for further
information on the tax effects on OCI related to the interest rate cap.
The location and gains (losses) on derivatives were recognized on the Consolidated Statements of Income as follows:
Year Ended December 31, | |||||||
Income Statement Caption | 2025 | 2024 | 2023 | ||||
Change in the fair value of the Deal- Contingent Forward | General and administrative | $— | $(4,532) | $(852) | |||
Total impact of derivatives not designated as hedging instruments | $— | $(4,532) | $(852) | ||||
Interest rate cap premium amortization | Interest expense, net | $(6,955) | $(6,955) | $(6,955) | |||
Amounts reclassified out of other comprehensive income related to the interest rate cap | Interest expense, net | 15,208 | 24,723 | 22,900 | |||
Total impact of derivatives designated as hedging instruments | $8,253 | $17,768 | $15,945 | ||||
The location and fair value of derivatives designated as hedging instruments were recognized on the Consolidated Balance
Sheets as follows:
As of December 31, | |||||
Balance Sheet Caption | 2025 | 2024 | |||
Interest rate cap | Other current assets | $— | $13,936 | ||
See Note 14, Fair Value Measurements, for further information on the fair value of derivatives.
13. VARIABLE INTEREST ENTITIES
As discussed in Note 1, Basis of Presentation, the Company consolidates the LLC as a VIE under ASC 810. The
Company’s financial position, financial performance, and cash flows effectively represent those of the LLC as of and for
the year ended December 31, 2025, with the exception of Cash and cash equivalents of $22.5 million, Other current assets
of $18.3 million, Deferred tax assets of $309.1 million, Accounts payable and accrued liabilities of $1.1 million, Other
non-current liabilities of $4.3 million, and the entire balance of the Tax Receivable Agreement liabilities of $459.0 million
on the Consolidated Balance Sheets, which are attributable solely to Ryan Specialty Holdings, Inc. As of December 31,
2024, Cash and cash equivalents of $27.2 million, Other current assets of $15.4 million, Deferred tax assets of $448.1
million, Accounts payable and accrued liabilities of $0.9 million, Other non-current liabilities of $2.9 million, and the
entire balance of the Tax Receivable Agreement liabilities of $436.3 million on the Consolidated Balance Sheet were
attributable solely to Ryan Specialty Holdings, Inc.
14. FAIR VALUE MEASUREMENTS
Accounting standards establish a three-tier fair value hierarchy that prioritizes the inputs used in measuring fair values as
follows:
Level 1: Observable inputs such as quoted prices for identical assets in active markets;
Level 2: Inputs other than quoted prices for identical assets in active markets, that are observable either directly or
indirectly; and
Level 3: Unobservable inputs in which there is little or no market data which requires the use of valuation techniques and
the development of assumptions.
The level in the fair value hierarchy within which the fair value measurement is classified is determined based on the
lowest level of input that is significant to the fair value measurement in its entirety.
117
The carrying amount of financial assets and liabilities reported on the Consolidated Balance Sheets for commissions and
fees receivable–net, other current assets, accounts payable, short-term debt, and other accrued liabilities as of December 31,
2025 and 2024, approximate fair value because of the short-term duration of these instruments. The fair value of long-term
debt, including the Term Loan, Senior Secured Notes, any current portion of such debt, and the units subject to mandatory
redemption, which were included only as of December 31, 2024, was $3,308.4 million and $3,275.1 million as of
December 31, 2025 and 2024, respectively. The fair value of the Term Loan and Senior Secured Notes would be classified
as Level 2 in the fair value hierarchy and the units subject to mandatory redemption would have been classified as Level 3.
See Note 8, Debt, for the carrying values of the Company’s debt.
Derivative Instruments
Deal-Contingent Foreign Currency Forward
The Company entered into the Deal-Contingent Forward to manage the risk of appreciation of the GBP-denominated
purchase price of the Castel acquisition. The fair value of the Deal-Contingent Forward was determined by comparing the
contractual foreign exchange rates to forward market rates for various future dates, probability weighted for when the
acquisition was anticipated to close, and discounted to the valuation date. The lowest level of inputs used that were
significant in determining the fair value were considered Level 3 inputs. See Note 12, Derivatives, for further information
on the Deal-Contingent Forward.
Interest Rate Cap
The Company used an interest rate cap to manage its exposure to interest rate fluctuations related to the Company’s Term
Loan. The fair value of the interest rate cap was determined using the market standard methodology of discounting the
future expected cash receipts that would occur if variable interest rates rose above the strike rate of the cap. The variable
interest rates used in the calculation of projected receipts on the cap were based on an expectation of future interest rates
derived from observable market interest rate curves and volatilities. The inputs used in determining the fair value of the
interest rate cap were considered Level 2 inputs. See Note 12, Derivatives, for further information on the interest rate cap.
Contingent Consideration
The fair values of contingent consideration and contingently returnable consideration are based on the present value of the
future expected payments to be made to the sellers and to be received from the sellers, respectively, of certain acquired
businesses in accordance with the provisions outlined in the respective purchase agreements, which are Level 3 fair value
measurements. In determining fair value, the Company estimates cash payments and receipts based on management’s
financial projections of the performance of each acquired business relative to the formula specified by each purchase
agreement. The Company utilizes Monte Carlo simulations to evaluate financial projections of each acquired business. The
Monte Carlo models consider forecasted revenue and EBITDA and market risk-adjusted revenue and EBITDA, which are
run through a series of simulations. As of December 31, 2025, the models used risk-free rates, expected volatility, and a
credit spread that ranged from 1.9% to 3.7%, 6.2% to 21.5%, and 0.8% to 2.7%, respectively. As of December 31, 2024,
the models used risk-free rates, expected volatility, and a credit spread that ranged from 3.5% to 5.4%, 6.8% to 18.7%, and
0.7% to 2.6%, respectively. The Company discounts the expected payments created by the Monte Carlo model to present
value using a risk-adjusted rate that takes into consideration the market-based rates of return that reflect the ability of the
acquired entity to achieve its targets. The discount rate ranges used to present value the cash payments as of December 31,
2025 and 2024, were 4.2% to 6.4% and 5.0% to 6.6%, respectively.
Each period, the Company revalues the contingent consideration and contingently returnable consideration associated with
certain prior acquisitions to their fair value and records the related changes of the fair value in Change in contingent
consideration on the Consolidated Statements of Income. Changes in contingent consideration result from changes in the
assumptions regarding probabilities of successful achievement of related EBITDA and revenue milestones, the estimated
timing in which milestones are achieved, and the discount rate used to estimate the fair value of the liability. Contingent
consideration may change significantly as the Company’s revenue growth rate and EBITDA estimates evolve and
additional data is obtained, impacting the Company’s assumptions. The use of different assumptions and judgments could
result in a materially different estimate of fair value which may have a material impact on the results from operations and
financial position. See Note 4, Mergers and Acquisitions, for further information on contingent consideration.
118
Assets and Liabilities Measured at Fair Value on a Recurring Basis
The following table presents information about the Company’s assets and liabilities measured at fair value on a recurring
basis by fair value hierarchy input level:
As of December 31, 2025 | As of December 31, 2024 | |||||||||||
Level 1 | Level 2 | Level 3 | Level 1 | Level 2 | Level 3 | |||||||
Assets | ||||||||||||
Interest rate cap | $— | $— | $— | $— | $13,936 | $— | ||||||
Contingently returnable consideration | — | — | 6,550 | — | — | 5,483 | ||||||
Liabilities | ||||||||||||
Contingent consideration | — | — | 148,388 | — | — | 129,059 | ||||||
Total assets and liabilities measured at fair value | $— | $— | $154,938 | $— | $13,936 | $134,542 | ||||||
Contingently returnable consideration of $3.3 million and $1.3 million was recorded in Other current assets on the
Consolidated Balance Sheets as of December 31, 2025 and 2024, respectively. Contingently returnable consideration of
$3.3 million and $4.2 million was recorded in Other non-current assets on the Consolidated Balance Sheets as of
December 31, 2025 and 2024, respectively. Contingent consideration of $55.9 million and $48.2 million was recorded in
Accounts payable and accrued liabilities on the Consolidated Balance Sheets as of December 31, 2025 and 2024,
respectively. Contingent consideration of $92.5 million and $80.9 million was recorded in Other non-current liabilities on
the Consolidated Balance Sheets as of December 31, 2025 and 2024, respectively.
Level 3 Assets and Liabilities Measured at Fair Value
The following is a reconciliation of the beginning and ending balances of the Level 3 assets and liabilities measured at fair
value:
Year Ended December 31, | ||||
2025 | 2024 | |||
Assets | ||||
Balance at beginning of period | $5,483 | $— | ||
Newly established assets due to acquisitions | — | 4,868 | ||
Total gains included in earnings | 2,567 | 684 | ||
Foreign currency translation adjustments included in OCI | 427 | (69) | ||
Settlements | (1,927) | — | ||
Balance at end of period | $6,550 | $5,483 | ||
Liabilities | ||||
Balance at beginning of period | $129,059 | $41,902 | ||
Newly established liabilities due to acquisitions1 | 46,002 | 103,769 | ||
Total (gains) losses included in earnings | 23,779 | (12,171) | ||
Foreign currency translation adjustments included in OCI | 22 | — | ||
Settlements | (49,007) | (5,384) | ||
Acquisition measurement period adjustments | (1,467) | 943 | ||
Balance at end of period | $148,388 | $129,059 | ||
1 For the year ended December 31, 2025, the activity includes contingent consideration liabilities established for immaterial
acquisitions not disclosed in Note 4, Mergers and Acquisitions.
For the year ended December 31, 2025, the $1.9 million settlement of contingently returnable consideration is presented in
the financing section of the Consolidated Statements of Cash Flows. For the year ended December 31, 2025, $19.4 million
and $29.3 million of contingent consideration settlements are presented in the operating and financing sections,
119
respectively, of the Consolidated Statements of Cash Flows. For the year ended December 31, 2024, $5.4 million related to
the loss on the settlement of the Deal-Contingent Forward is presented in the operating section of the Consolidated
Statements of Cash Flows.
15. COMMITMENTS AND CONTINGENCIES
Legal – E&O and Other Considerations
As an E&S and Admitted markets intermediary, the Company faces ordinary course of business E&O exposure. The
Company also has potential E&O risk if an insurance carrier with which Ryan Specialty placed coverage denies coverage
for a claim or pays less than the insured believes is the full amount owed. The Company seeks to resolve, through
commercial accommodations, certain matters to limit the economic exposure, including potential legal fees, and
reputational risk created by E&O matters as well as disagreements between a carrier and the insured.
The Company utilizes insurance to provide protection from E&O liabilities that may arise during the ordinary course of
business. Ryan Specialty’s E&O insurance provides aggregate coverage for E&O losses up to $150.0 million in excess of a
per claim retention amount of $5.0 million. The Company periodically determines a range of possible outcomes using the
best available information that relies, in part, on projecting historical claim data into the future. Loss contingencies of $3.2
million and $4.9 million were recorded for outstanding matters as of December 31, 2025 and 2024, respectively. Loss
contingencies exclude the impact of any loss recoveries. The Company recognized the net impact of loss contingencies and
any loss recoveries of $4.0 million, $1.8 million, and $6.9 million of E&O expense for the years ended December 31, 2025,
2024, and 2023, respectively, in General and administrative expense on the Consolidated Statements of Income. The
historical claim and commercial accommodation data used to project the current estimates may not be indicative of future
claim activity. Thus, the estimates could change in the future as more information becomes known, which could materially
impact the amounts reported and disclosed herein.
During 2022, the Company placed certain insurance policies through a trading partner with the understanding that the
policies were underwritten by highly rated insurance capital. The policies were instead underwritten by an insurance carrier
that was not considered satisfactory by the Company or the insureds. The Company committed to securing replacement
coverage, to the extent commercially available, from highly rated insurance companies on terms substantially similar to the
insurance coverage originally agreed upon. As a result of this unusual circumstance, the Company incurred losses arising
from the original placements and unpaid covered claims (collectively, the “Replacement Costs”).
The Company recognized an estimated loss contingency related to the Replacement Costs of $0.3 million and a loss
recovery related to the claim for Replacement Costs of $20.2 million within Accounts payable and accrued liabilities and
Other current assets, respectively, on the Consolidated Balance Sheets as of December 31, 2024. During the year ended
December 31, 2025, the Company collected $22.1 million from its E&O insurance carriers related to the claim for the
Replacement Costs and there was no remaining loss recovery outstanding at December 31, 2025. In the aggregate, the loss
contingency and related loss recovery resulted in a $2.5 million expense recognized in the year ended December 31, 2022,
and no further expense related to this matter has been recognized since. The Company does not expect any additional
Replacement Costs to arise in relation to this matter.
16. RELATED PARTIES
Equity Method Investments
Ryan Investment Holdings
Ryan Investment Holdings, LLC (“RIH”) was formed as an investment holding company designed to aggregate the funds
of Ryan Specialty and Geneva Ryan Holdings, LLC (“GRH”) for investment in Geneva Re Partners, LLC (“GRP”). GRH
was formed as an investment holding company designed to aggregate investment funds of Patrick G. Ryan and other
affiliated investors. Two affiliated investors are LLC Unitholders and directors of the Company, and another is an LLC
Unitholder and employee of the Company. Ryan Specialty does not consolidate GRH as the Company does not have a
direct investment in or variable interest in this entity.
The Company holds a 47% interest in RIH and GRH holds the remaining 53% interest. RIH has a 50% non-controlling
interest in GRP and the other 50% is owned by Nationwide Mutual Insurance Company. GRP wholly owns Geneva Re, a
Bermuda-regulated reinsurance company, and GR Bermuda SAC Ltd (the “Segregated Account Company”). The
Segregated Account Company has one segregated account, which is beneficially owned by a third-party insurance
company (the “Third-party Insurer”). RIH is considered a related party variable interest entity under common control with
120
the Company. The Company is not most closely associated with the variable interest entity and therefore does not
consolidate RIH. The assets of RIH are restricted to settling obligations of RIH, pursuant to Delaware limited liability
company statutes.
The Company is not required to contribute any additional capital to RIH, and its maximum exposure to loss on the equity
method investment is the total invested capital of $47.0 million. The Company may be exposed to losses arising from the
equity method investment as a result of underwriting losses recognized at Geneva Re or losses on Geneva Re’s investment
portfolio. The carrying value of the Company’s equity method investment in RIH was $92.7 million and $70.9 million as
of December 31, 2025 and 2024, respectively. RIH has committed to contribute additional capital to GRP over the next
several years. Patrick G. Ryan, through a trust of which he is the beneficiary and co-trustee, has committed to personally
fund any such additional capital contributions. Any such additional capital contributions under this commitment will not
affect the relative ownership of RIH’s common equity.
Velocity Specialty Insurance Company
On May 1, 2025, the Company acquired a 9.9% interest in VSIC, an insurance carrier writing middle market and small to
medium business risks in catastrophe exposed areas, for $16.6 million. The Company accounts for its investment in VSIC
under the equity method of accounting as the Company has the ability to exercise significant influence over VSIC primarily
through board representation. The carrying value of the Company’s equity method investment in VSIC was $17.3 million
as of December 31, 2025.
Other Related Parties
Geneva Re
The Company has a service agreement with Geneva Re to provide both administrative services to, as well as disburse
payments for costs directly incurred by, Geneva Re. These direct costs include compensation expenses incurred by
employees of Geneva Re. The Company had $0.3 million due from Geneva Re under this agreement as of December 31,
2025 and 2024.
Ryan Re Services Agreements with Geneva Re
Ryan Re, a wholly owned subsidiary of the Company, is party to a services agreement with Geneva Re to provide, among
other services, certain underwriting and administrative services to Geneva Re. Ryan Re receives a service fee equal to
115% of the administrative costs incurred by Ryan Re in providing these services to Geneva Re. Revenue earned from
Geneva Re was $1.6 million, $1.5 million, and $1.5 million for the years ended December 31, 2025, 2024, and 2023,
respectively. Receivables due from Geneva Re under this agreement were $0.8 million and $0.7 million as of December 31,
2025 and 2024, respectively.
Ryan Re is party to a services agreement with Geneva Re under which Ryan Re subcontracts certain services to Geneva Re
that are required for the segregated account of the Segregated Account Company on behalf of the Third-party Insurer. The
Company incurred expense of $11.7 million, $10.5 million, and $7.5 million during the years ended December 31, 2025,
2024, and 2023, respectively. The Company had prepaid expenses of $6.4 million and $5.2 million as of December 31,
2025 and 2024, respectively, related to this services agreement. The prepaid expenses are included in Other currents assets
on the Consolidated Balance Sheets.
Claims Management Agreement with VSIC
Velocity Claims, LLC (“Velocity Claims”) and Velocity, wholly owned subsidiaries of the Company, are party to a claims
management agreement with VSIC under which Velocity Claims receives compensation equal to 1% of indemnity and
expenses paid, net of subrogation, on each claim that Velocity participates on. Revenue recognized from this agreement
was $0.3 million during the year ended December 31, 2025. Receivables due from VSIC under this agreement were $0.1
million as of December 31, 2025.
Company Leasing of Corporate Jets
In the ordinary course of its business, the Company charters executive jets for business purposes from Executive Jet
Management (“EJM”), a third-party service provider. Mr. Ryan indirectly owns aircraft that he leases to EJM for EJM’s
charter operations for which he receives remuneration from EJM. The Company pays market rates for chartering aircraft
through EJM, unless the particular aircraft chartered is Mr. Ryan’s, in which case the Company receives a discount below
121
market rates. Historically, the Company has been able to charter Mr. Ryan’s aircraft and make use of this discount. The
Company recognized expense related to business usage of the aircraft of $0.9 million, $1.2 million, and $1.0 million for the
years ended December 31, 2025, 2024, and 2023, respectively.
Personal Guarantee
In April 2021, Mr. Ryan personally guaranteed up to $10.0 million of the financial obligations of the Company under an
agency agreement with certain insurance companies that are affiliated with National Indemnity Company. The Company
did not pay Mr. Ryan any consideration for this guarantee. Mr. Ryan’s guarantee may be replaced by the Company with a
letter of credit at any time, subject to the prior approval of the insurance companies. Mr. Ryan will not personally guarantee
any further additional financial obligations of the Company or any of its subsidiaries.
17. INCOME TAXES
The Company is taxed as a corporation for income tax purposes and is subject to federal, state, and local taxes with respect
to its allocable share of any net taxable income from the LLC. The LLC is a limited liability company taxed as a
partnership for income tax purposes, and its taxable income or loss is passed through to its members, including the
Company. The LLC is subject to income taxes on its taxable income in certain foreign countries, in certain state and local
jurisdictions that impose income taxes on partnerships, and on the taxable income of its U.S. corporate subsidiaries.
The components of income before income taxes were as follows:
Year Ended December 31, | ||||||
2025 | 2024 | 2023 | ||||
United States | $314,465 | $270,345 | $224,813 | |||
Foreign | (21,281) | 2,209 | 13,112 | |||
Income before income taxes | $293,184 | $272,554 | $237,925 | |||
The components of income tax expense were as follows:
Year Ended December 31, | ||||||
2025 | 2024 | 2023 | ||||
Current income tax expense (benefit) | ||||||
Federal | $(3,935) | $3,494 | $9,179 | |||
State | 3,353 | 3,704 | 3,338 | |||
Foreign | 4,965 | 9,126 | 5,438 | |||
Current income tax expense | $4,383 | $16,324 | $17,955 | |||
Deferred income tax expense (benefit) | ||||||
Federal | 67,371 | 20,497 | 31,941 | |||
State | 16,310 | 7,429 | (5,454) | |||
Foreign | (9,037) | (1,609) | (997) | |||
Deferred income tax expense | $74,644 | $26,317 | $25,490 | |||
Total income tax expense (benefit) | ||||||
Federal | 63,436 | 23,991 | 41,120 | |||
State | 19,663 | 11,133 | (2,116) | |||
Foreign | (4,072) | 7,517 | 4,441 | |||
Total income tax expense | $79,027 | $42,641 | $43,445 | |||
122
Reconciliations of income tax expense computed at the U.S. federal statutory income tax rate to the recognized income tax
expense and the U.S. statutory income tax rate to the Company’s effective tax rates are as follows:
Year Ended December 31, | ||||||||||||
2025 | 2024 | 2023 | ||||||||||
Income taxes at U.S. federal statutory rate | $61,569 | 21.0% | $57,236 | 21.0% | $49,964 | 21.0% | ||||||
Nontaxable and nondeductible items | ||||||||||||
Income attributable to non-controlling interests and nontaxable income | (33,937) | (11.6%) | (29,898) | (10.9%) | (27,265) | (11.6%) | ||||||
Nondeductible expenses | 3,960 | 1.4% | 2,579 | 0.9% | 2,286 | 1.0% | ||||||
Effect of cross-border tax laws | (1,636) | (0.6%) | (1,449) | (0.5%) | 256 | 0.1% | ||||||
Changes in valuation allowances | — | —% | 2,191 | 0.8% | 2,908 | 1.2% | ||||||
Equity-based compensation | (13,770) | (4.7%) | (11,209) | (4.1%) | (1,994) | (0.8%) | ||||||
Common Control Reorganizations1 | 39,260 | 13.4% | 7,116 | 2.6% | 15,142 | 6.4% | ||||||
Change in fair value of contingent consideration2 | 3,930 | 1.3% | — | —% | — | —% | ||||||
Other federal | (409) | (0.1%) | (2,106) | (0.8%) | 2,573 | 1.1% | ||||||
State and local income tax expense (benefit), net of federal benefit3 | 19,663 | 6.7% | 11,133 | 4.1% | (2,116) | (0.9%) | ||||||
Foreign tax effects | ||||||||||||
United Kingdom | ||||||||||||
Nondeductible acquisition expenses | 272 | 0.1% | 4,309 | 1.6% | — | —% | ||||||
Nontaxable dividends and profit distributions | — | —% | — | —% | (2,971) | (1.2%) | ||||||
Other | (2,074) | (0.7%) | 264 | 0.1% | 1,564 | 0.7% | ||||||
Spain | ||||||||||||
Nondeductible profit distributions | — | —% | — | —% | 3,844 | 1.6% | ||||||
Other | 509 | 0.2% | 533 | 0.2% | (599) | (0.3%) | ||||||
Other foreign jurisdictions | 1,690 | 0.6% | 1,942 | 0.7% | (147) | (0.1%) | ||||||
Income tax expense | $79,027 | 27.0% | $42,641 | 15.7% | $43,445 | 18.2% | ||||||
1 The total non-cash deferred income tax expense resulting from CCRs for the years ended December 31, 2025, 2024, and
2023, was $48.6 million, $9.5 million, and $18.4 million, respectively, of which $39.3 million, $7.1 million, and $15.1
million, respectively, was included in Domestic federal, and the remaining $9.3 million, $2.4 million, and $3.3 million,
respectively, was included in State and local income tax expense (benefit), net of federal benefit. Refer to the Common
Control Reorganization section below for more information.
2 Represents the income tax expense impact from the change in fair value of contingent consideration recognized for
acquisitions that resulted in CCRs.
3 For the year ended December 31, 2025, state and local income taxes in California, New York, New York City, and Texas
comprised the majority of this category. For the year ended December 31, 2024, state and local income taxes in California,
Illinois, New York, and New York City comprised the majority of this category. For the year ended December 31, 2023,
state and local income taxes in California, Illinois, and New York comprised the majority of this category.
Common Control Reorganizations (CCRs)
Subsequent to the acquisition of Velocity, which was acquired by a wholly owned subsidiary of Ryan Specialty Holdings,
Inc., the Company converted Velocity into an LLC (“Velocity LLC”) and transferred Velocity LLC to the LLC. This legal
entity reorganization was considered a transaction between entities under common control. The CCR, inclusive of impacts
from the Velocity measurement period adjustments, resulted in a reduction of deferred tax assets in the Company’s basis
difference in its investment in the LLC of $146.0 million and a non-cash deferred income tax expense of $48.9 million for
the year ended December 31, 2025. Additionally, the difference between the carrying value and the fair value of the
investment transferred under common control resulted in an increase of $29.8 million to Non-controlling interests on the
Consolidated Statements of Stockholders’ Equity during the year ended December 31, 2025.
Subsequent to the acquisition of Innovisk, which was purchased by Ryan Specialty Holdings, Inc., the Company
reorganized Innovisk and transferred the resulting LLCs and foreign subsidiaries to the LLC. This legal entity
123
reorganization was considered a transaction between entities under common control. The CCR resulted in deferred tax
liabilities of $40.7 million and a non-cash deferred income tax expense of $11.4 million for the year ended December 31,
2024. Additionally, the difference between the carrying value and the fair value of the investments transferred under
common control resulted in an increase of $7.3 million to Non-controlling interests on the Consolidated Statements of
Stockholders’ Equity during the year ended December 31, 2024. During the year ended December 31, 2025, as a result of
measurement period adjustments for Innovisk, the Company recognized $0.3 million of non-cash deferred income tax
benefit.
Subsequent to the acquisitions of Socius and AccuRisk, which were purchased by a wholly owned subsidiary of Ryan
Specialty Holdings, Inc., the Company converted Socius to an LLC and reorganized AccuRisk and transferred those LLCs
to the LLC. These legal entity reorganizations were considered transactions between entities under common control. The
CCRs resulted in a net, non-cash deferred income tax expense of $18.4 million for the year ended December 31, 2023.
Additionally, the difference between the carrying value and the fair value of the investments transferred under common
control resulted in an increase of $18.9 million to Non-controlling interests on the Consolidated Statements of
Stockholders’ Equity during the year ended December 31, 2023. During the year ended December 31, 2024, as a result of
measurement period adjustments for AccuRisk, the Company recognized $1.9 million of non-cash deferred income tax
benefit.
Uncertain Tax Positions
The Company does not believe it has any significant uncertain tax positions and therefore has no unrecognized tax benefits
as of December 31, 2025, that if recognized would affect the annual effective tax rate. The 2022 through 2024 tax years for
the Company, the LLC, and the Company’s C-Corporation subsidiaries are considered open for purposes of federal
examination. The 2021 through 2024 tax years for the Company’s material foreign tax jurisdictions, the United Kingdom
and Spain, are considered open for purposes of examination. As of the issuance date of this Form 10-K, one of the LLC’s
subsidiaries is under state examination for the 2020 tax year. There are no other ongoing U.S. federal, state, or foreign tax
audits or examinations as of the date of issuance of this Form 10-K.
Deferred Tax Assets and Liabilities
The components of deferred tax assets and liabilities were as follows:
As of December 31, | ||||
2025 | 2024 | |||
Deferred tax assets | ||||
Net operating losses | $23,895 | $14,687 | ||
Investment in the LLC | 287,978 | 429,850 | ||
Start-up costs | 5,702 | 6,246 | ||
Equity-based compensation | 2,287 | 1,628 | ||
Tax credits | 4,239 | 5,491 | ||
Capitalized research and development | 874 | 890 | ||
Other accrued items | 786 | 151 | ||
Total deferred tax assets | $325,761 | $458,943 | ||
Valuation allowances | (11,162) | (7,759) | ||
Deferred tax assets, net of valuation allowances | $314,599 | $451,184 | ||
Deferred tax liabilities | ||||
Intangibles | (54,237) | (42,817) | ||
Fixed assets | (58) | — | ||
Other accrued items | — | — | ||
Deferred tax liabilities | $(54,295) | $(42,817) | ||
Net Deferred tax assets | $260,304 | $408,367 | ||
During the year ended December 31, 2025, the decrease in Deferred tax assets was primarily driven by reductions in the
investment in the LLC’s deferred tax assets arising from the CCRs described above.
124
As of December 31, 2025, the Company had $60.4 million of federal net operating loss (“NOL”) carryforwards with an
indefinite carryforward period, $40.5 million of state NOL carryforwards that will begin to expire in 2030, and $33.2
million of foreign NOL carryforwards that will begin to expire in 2030. The Company has recorded valuation allowances
of $15.5 million and $23.1 million against the state and foreign NOLs, respectively.
As of December 31, 2025, the Company had $4.2 million in foreign tax credit carryforwards that will begin to expire in
2026. The Company assessed the available positive and negative evidence, including tax planning strategies and recent
results of foreign operations, to determine whether it was more likely than not that the existing deferred tax asset would be
realized. A significant piece of objective negative evidence evaluated was the inability to use all available foreign tax
credits for the year ended December 31, 2025. On the basis of this evaluation, a full valuation allowance of $4.2 million
was recorded with respect to this deferred tax asset as of December 31, 2025. The amount of the deferred tax asset
considered realizable, however, could be adjusted in the future if estimates of the Company’s ability to use the available
foreign tax credits change.
With the exception of the NOLs and tax credits discussed above, as of December 31, 2025, the Company concluded that,
based on the weight of all available positive and negative evidence, the majority of the Company’s deferred tax assets are
more likely than not to be realized. As such, no other valuation allowances have been recognized against those deferred tax
assets. The valuation allowances recognized will be maintained until there is sufficient evidence to support the reversal of
all or some portion of the allowances.
Cash Paid for Income Taxes
The cash paid for income taxes, net of refunds was as follows:
Year Ended December 31, | ||||||
2025 | 2024 | 2023 | ||||
Federal | $200 | $13,485 | $7,339 | |||
State and local | ||||||
Texas | 1,122 | — | — | |||
New York City | 1,026 | 1,268 | 1,399 | |||
Other state and local | 737 | 1,333 | 690 | |||
Foreign | ||||||
United Kingdom | 3,056 | 4,291 | 2,248 | |||
Netherlands | 2,250 | 570 | — | |||
Spain | 4,240 | 3,778 | 2,076 | |||
Sweden | 1,286 | 2,528 | 2,551 | |||
Other foreign | 427 | 78 | 98 | |||
Total cash paid for income taxes, net of refunds | $14,344 | $27,331 | $16,401 | |||
125
Tax Receivable Agreement (TRA)
The Company recognizes a liability on the Consolidated Balance Sheets based on the undiscounted estimated future
payments under the TRA. The amounts payable under the TRA will vary depending upon a number of factors, including
the amount, character, and timing of the taxable income of the Company in the future. Based on current projections, the
Company anticipates having sufficient taxable income to be able to realize the benefits and has recorded Tax Receivable
Agreement liabilities of $459.0 million related to these benefits on the Consolidated Balance Sheets as of December 31,
2025. The following summarizes activity related to the Tax Receivable Agreement liabilities:
Exchange Tax Attributes | Pre-IPO M&A Tax Attributes | TRA Payment Tax Attributes | TRA Liabilities | |||||
Balance at December 31, 2023 | $194,668 | $85,814 | $78,416 | $358,898 | ||||
Exchange of LLC Common Units | 73,433 | 5,660 | 21,982 | 101,075 | ||||
Remeasurement – change in state rate | (932) | (391) | (1,183) | (2,506) | ||||
Remeasurement – foreign tax credits | (895) | — | — | (895) | ||||
Interest expense | — | — | 1,302 | 1,302 | ||||
Payments | (13,041) | (7,668) | (869) | (21,578) | ||||
Balance at December 31, 2024 | $253,233 | $83,415 | $99,648 | $436,296 | ||||
Exchange of LLC Common Units | 34,813 | 2,466 | 9,479 | 46,758 | ||||
Interest expense | — | — | 1,112 | 1,112 | ||||
Payments | (16,067) | (8,532) | (570) | (25,169) | ||||
Balance at December 31, 2025 | $271,979 | $77,349 | $109,669 | $458,997 |
The increases in the TRA liabilities due to exchanges of LLC Common Units for Class A common stock were recognized
in Additional paid-in capital on the Consolidated Statements of Stockholders’ Equity and increases in the TRA liabilities
due to accrued interest were recognized in Other non-operating loss (income) on the Consolidated Statements of Income.
During the year ended December 31, 2024, the Company remeasured the TRA liabilities due to changes in state tax rates,
which decreased its estimated cash tax savings from 26.12% to 26.00%. The changes were recognized in Other non-
operating loss (income) on the Consolidated Statements of Income. Total realized tax savings in 2025 for the year ended
December 31, 2024, from each of the tax attributes associated with the TRA were $28.9 million; $24.6 million, exclusive
of the related accrued interest, was paid to current and certain former LLC unitholders, representing 85% of the realized tax
savings. The remaining 15%, or $4.3 million, of the realized tax savings was retained by the Company.
Non-controlling Interest Holders’ Tax Distributions
The Company declared tax distributions to the non-controlling interest holders of $62.5 million, $84.8 million, and $74.6
million during the years ended December 31, 2025, 2024, and 2023, respectively. Non-controlling interest holders’ tax
distributions for quarterly estimates are generally paid throughout the year they relate to, and a final payment is made in the
first half of the subsequent year.
Other Comprehensive Income (Loss)
The following table summarizes the tax effects on the components of OCI:
Year Ended December 31, | ||||||
2025 | 2024 | 2023 | ||||
Gain on interest rate cap | $(1,359) | $(1,945) | $(1,628) | |||
Gain on interest rate cap reclassified to earnings | 1,867 | 3,101 | 2,734 | |||
Foreign currency translation adjustments | (5,901) | 1,370 | (272) | |||
Change in share of equity method investments’ other comprehensive income (loss) | (101) | (842) | 173 | |||
126
18. ACCUMULATED OTHER COMPREHENSIVE INCOME (LOSS)
Changes in the balance of Accumulated other comprehensive income (loss), net of tax, were as follows:
Gain on Interest Rate Cap | Foreign Currency Translation Adjustments | Change in EMI Other Comprehensive Income (Loss)1 | Total | |||||
Balance at December 31, 2022 | $8,065 | $157 | $(2,187) | $6,035 | ||||
Other comprehensive income (loss) before reclassifications | 12,028 | 2,125 | (973) | 13,180 | ||||
Amounts reclassified to earnings | (20,161) | — | — | (20,161) | ||||
Other comprehensive income (loss) | $(8,133) | $2,125 | $(973) | $(6,981) | ||||
Less: Non-controlling interests | (4,765) | 1,300 | (557) | (4,022) | ||||
Balance at December 31, 2023 | $4,697 | $982 | $(2,603) | $3,076 | ||||
Other comprehensive income (loss) before reclassifications | 14,003 | (8,914) | 5,708 | 10,797 | ||||
Amounts reclassified to earnings | (21,623) | — | — | (21,623) | ||||
Other comprehensive income (loss) | $(7,620) | $(8,914) | $5,708 | $(10,826) | ||||
Less: Non-controlling interests | (4,358) | (4,922) | 3,326 | (5,954) | ||||
Balance at December 31, 2024 | $1,435 | $(3,010) | $(221) | $(1,796) | ||||
Other comprehensive income before reclassifications | 6,881 | 41,129 | 664 | 48,674 | ||||
Amounts reclassified to earnings | (13,342) | — | — | (13,342) | ||||
Other comprehensive income (loss) | $(6,461) | $41,129 | $664 | $35,332 | ||||
Less: Non-controlling interests | (5,026) | 24,341 | 376 | 19,691 | ||||
Balance at December 31, 2025 | $— | $13,778 | $67 | $13,845 |
1 Change in share of equity method investments’ other comprehensive income (loss) on the Consolidated Statements of
Comprehensive Income.
127
19. SEGMENT REPORTING
Segment Information
Ryan Specialty is organized as a single operating and reporting segment. The Company’s chief operating decision maker
(“CODM”) is its Chief Executive Officer. The Company has identified its single operating segment utilizing a management
approach that aligns with the manner in which the CODM utilizes the Company’s consolidated financial information for
resource allocation and performance evaluation. Refer to Note 1, Basis of Presentation, for a description of the Company’s
products and services and to Note 3, Revenue from Contracts with Customers, for the disaggregation of revenue by
Specialty.
The CODM utilizes consolidated net income as the primary metric to monitor budget versus actual results, assess the
performance of the business, and make decisions regarding resource allocation. The following table provides information
about the Company’s revenue and includes a reconciliation to net income:
Year Ended December 31, | ||||||
2025 | 2024 | 2023 | ||||
Net commissions and fees | $2,994,582 | $2,455,671 | $2,026,596 | |||
Fiduciary investment income | 56,544 | 60,039 | 50,953 | |||
Total revenue | $3,051,126 | $2,515,710 | $2,077,549 | |||
Compensation-related expense1 | 1,692,000 | 1,426,674 | 1,222,342 | |||
General and administrative expense2 | 392,384 | 277,813 | 230,467 | |||
Other segment items3 | 172,465 | 238,640 | 144,401 | |||
Depreciation and amortization | 287,515 | 167,630 | 115,837 | |||
Change in contingent consideration | 13,122 | (22,859) | 5,421 | |||
Interest income | (7,649) | (21,509) | (31,986) | |||
Interest expense | 230,033 | 179,957 | 151,493 | |||
Income from equity method investments | (21,236) | (18,231) | (8,731) | |||
Other non-operating loss (income) | (692) | 15,041 | 10,380 | |||
Income tax expense | 79,027 | 42,641 | 43,445 | |||
Net income | $214,157 | $229,913 | $194,480 | |||
1 Compensation-related expense includes salaries, commissions, bonus compensation, benefits, payroll taxes, and
contractor costs, and excludes equity-based compensation expense, and acquisition and restructuring related expenses.
2 General and administrative expense includes travel and entertainment, professional services, occupancy, IT related costs,
and other operating costs, and excludes acquisition and restructuring related expenses.
3 Other segment items include equity-based compensation expense, and acquisition and restructuring related compensation
and general and administrative expenses.
Geographic Information
Revenue is primarily recognized based on the country in which the services are performed. The following table illustrates
the geographic regions for the Company’s revenue:
Year Ended December 31, | ||||||
2025 | 2024 | 2023 | ||||
United States | $2,864,242 | $2,391,980 | $2,022,579 | |||
Foreign | 186,884 | 123,730 | 54,970 | |||
Total revenue | $3,051,126 | $2,515,710 | $2,077,549 | |||
The Company did not have material revenue from operations in any individual foreign country for the years ended
December 31, 2025, 2024, or 2023. Asset information is not presented to the CODM. Substantially all of the Company’s
128
tangible long-lived assets are located in the United States; therefore, geographic information for long-lived assets is not
presented.
20. SUPPLEMENTAL FINANCIAL INFORMATION
Interest Income
The Company earned interest income of $7.6 million, $21.5 million, and $32.0 million during the years ended
December 31, 2025, 2024, and 2023, respectively, on its operating Cash and cash equivalents. Interest income is
recognized in Interest expense, net on the Consolidated Statements of Income.
Supplemental Cash Flow Information
The following represents the supplemental cash flow information of the Company:
Year Ended December 31, | ||||||
2025 | 2024 | 2023 | ||||
Cash paid for: | ||||||
Interest, net1 | $196,041 | $136,953 | $128,380 | |||
Non-cash investing and financing activities: | ||||||
Non-controlling interest holders’ tax distributions declared but unpaid | $478 | $2,109 | $35 | |||
Tax Receivable Agreement liabilities | 46,758 | 101,075 | 68,587 | |||
Dividend Equivalents and Declared Distributions liabilities | 1,770 | 4,246 | — | |||
Contingently returnable consideration | — | 4,868 | — | |||
Contingent consideration liabilities | 44,535 | 103,769 | 11,238 | |||
1 Interest paid is presented net of $15.2 million, $24.7 million, and $22.9 million of cash received in connection with the
Company’s interest rate cap for the years ended December 31, 2025, 2024, and 2023, respectively. See Note 12,
Derivatives, for further information on the interest rate cap.
21. RESTRUCTURING
In February 2023, the Company initiated the ACCELERATE 2025 program to enable continued growth, drive innovation,
and deliver sustainable productivity improvements over the long term. The restructuring plan aimed to reduce costs and
increase efficiencies through a focus on optimizing the Company’s operations and technology. In its expanded form, the
restructuring plan was expected to incur total restructuring costs of approximately $110.0 million through December 31,
2024. The total expected costs of the plan included $55.0 million related to operations and technology optimization, $40.0
million related to employee compensation and benefits, and $15.0 million related to asset impairment and other termination
costs. The plan was completed on December 31, 2024, as anticipated.
The table below presents the restructuring expense incurred:
Year Ended December 31, | ||||||
2024 | 2023 | Total | ||||
Operations and technology optimization | $27,162 | $25,995 | $53,157 | |||
Compensation and benefits | 32,217 | 11,320 | 43,537 | |||
Asset impairment and other termination costs | 318 | 11,057 | 11,375 | |||
Total | $59,697 | $48,372 | $108,069 | |||
During the years ended December 31, 2024 and 2023, the Company recognized restructuring expenses of $39.9 million and
$22.6 million, respectively, including contractor costs, in Compensation and benefits, and $19.8 million and $25.8 million,
respectively, in General and administrative expense on the Consolidated Statements of Income.
129
The table below presents a summary of changes in the restructuring liability:
Operations and Technology Optimization | Compensation and Benefits | Asset Impairment and Other Termination Costs | Total | |||||
Balance at December 31, 2023 | $5,886 | $1,080 | $— | $6,966 | ||||
Accrued costs | 49,885 | 32,217 | 318 | 82,420 | ||||
Payments | (38,788) | (29,467) | — | (68,255) | ||||
Non-cash adjustments | — | — | (318) | (318) | ||||
Balance at December 31, 2024 | $16,983 | $3,830 | $— | $20,813 |
Accrued costs in the table above include both costs expensed and capitalized during the period. As of December 31, 2024
and 2023, $15.3 million and $5.3 million, respectively, of the restructuring liability was included in Accounts payable and
accrued liabilities and $5.5 million and $1.7 million, respectively, was included in Current Accrued compensation on the
Consolidated Balance Sheets. The total restructuring liability outstanding as of December 31, 2024, was paid during the
year ended December 31, 2025.
22. SUBSEQUENT EVENTS
The Company has evaluated subsequent events through February 13, 2026, and has concluded that no events have occurred
that require disclosure other than the events listed below.
On February 10, 2026, the Company’s Board of Directors approved a share repurchase program that authorizes the
Company to repurchase up to $300.0 million of its outstanding Class A common stock. Share repurchases may be made
from time to time on the open market, in privately negotiated transactions, using Rule 10b5-1 trading plans, as accelerated
share repurchases, or in any other manner that complies with the applicable securities law. The timing of purchases and
number of shares repurchased under the program will depend upon a variety of factors including the Company’s stock
price, trading volume, working capital or other liquidity requirements, and market conditions. The Company is not
obligated to purchase any shares under the program and the program may be suspended or discontinued at any time without
notice.
On February 12, 2026, the Company’s Board of Directors approved a quarterly cash dividend of $0.13 per share of
outstanding Class A common stock. The quarterly dividend will be payable on March 10, 2026, to shareholders of record
of Class A common stock as of the close of business on February 24, 2026. Any future dividends will be subject to the
approval of the Company’s Board of Directors.
On February 12, 2026, the Company announced the Empower program, a three-year restructuring program commencing in
the first quarter of 2026. The program is expected to result in approximately $160.0 million of cumulative one-time charges
through 2028 and to generate annual savings of approximately $80.0 million in 2029.
130
ITEM 9. CHANGES IN AND DISAGREEMENTS WITH ACCOUNTANTS ON ACCOUNTING AND
FINANCIAL DISCLOSURE
None.
ITEM 9A. CONTROLS AND PROCEDURES
Evaluation of Disclosure Controls and Procedures
We maintain “disclosure controls and procedures,” as defined in Rule 13a–15(e) and Rule 15d–15(e) under the
Exchange Act, that are designed to provide reasonable assurance that information required to be disclosed by the Company
in the reports that we file or submit under the Exchange Act is recorded, processed, summarized, and reported within the
time periods specified in the SEC’s rules and forms. Disclosure controls and procedures include, without limitation,
controls and procedures designed to provide reasonable assurance that information required to be disclosed by the
Company in the reports that we file or submit under the Exchange Act is accumulated and communicated to our
management, including our principal executive and principal financial officers, as appropriate to allow timely decisions
regarding required disclosure. Based on such evaluation, our principal executive officer and principal financial officer have
concluded that as of December 31, 2025, our disclosure controls and procedures were effective at the reasonable assurance
level.
Management’s Report on Internal Control Over Financial Reporting
Management of Ryan Specialty is responsible for establishing and maintaining adequate internal control over
financial reporting as defined in Rules 13a-15(f) and 15d-15(f) under the Exchange Act. The Company’s internal control
over financial reporting is designed to provide reasonable assurance regarding the reliability of financial reporting and the
preparation of financial statements for external purposes in accordance with U.S. GAAP, and includes those policies and
procedures that:
(1)Pertain to the maintenance of records that in reasonable detail accurately and fairly reflect the transactions
and dispositions of the assets of the Company;
(2)Provide reasonable assurance that transactions are recorded as necessary to permit preparation of financial
statements in accordance with generally accepted accounting principles and that receipts and expenditures
of the Company are being made only in accordance with authorizations of management and directors of the
Company; and
(3)Provide reasonable assurance regarding prevention or timely detection of unauthorized acquisition, use or
disposition of the Company’s assets that could have a material effect on the financial statements.
Internal control over financial reporting cannot provide absolute assurance of achieving financial reporting
objectives because of its inherent limitations. Internal control over financial reporting is a process that involves human
diligence and compliance and is subject to lapses in judgment and breakdowns resulting from human failures. Internal
control over financial reporting can also be circumvented by collusion or improper management override. Because of such
limitations, there is a risk that material misstatements may not be prevented or detected on a timely basis by internal control
over financial reporting. However, these inherent limitations are known features of the financial reporting process.
Therefore, it is possible to design into the process safeguards to reduce, though not eliminate, this risk.
Under the supervision and with the participation of our senior management, including our Chief Executive
Officer and Chief Financial Officer, we assessed the effectiveness of our internal control over financial reporting as of
December 31, 2025. In making this assessment, we used the criteria set forth by the Committee of Sponsoring
Organizations of the Treadway Commission in the Internal Control - Integrated Framework (2013 Framework). Based on
this assessment, management has concluded that the Company maintained effective internal control over financial
reporting as of December 31, 2025.
The effectiveness of our internal control over financial reporting as of December 31, 2025, has been audited by
Deloitte & Touche LLP, the Company’s independent registered public accounting firm. The attestation report of our
independent registered public accounting firm on the effectiveness of our internal control over financial reporting is set
forth in Item 8 of this Annual Report on Form 10-K.
131
Changes in Internal Control Over Financial Reporting
There have been no changes in internal control over financial reporting during the three months ended
December 31, 2025, that have materially affected, or are reasonably likely to materially affect, our internal control over
financial reporting.
ITEM 9B. OTHER INFORMATION
Insider Trading Arrangements and Policies
During the quarter ended December 31, 2025, none of our directors or officers (as defined in Section 16 of the
Securities Exchange Act of 1934, as amended), adopted or terminated a “Rule 10b5-1 trading arrangement” or a “non-Rule
10b5-1 trading arrangement” (each as defined in Item 408 of Regulation S-K).
ITEM 9C. DISCLOSURE REGARDING FOREIGN JURISDICTIONS THAT PREVENT INSPECTIONS.
Not applicable
132
PART III
ITEM 10. DIRECTORS, EXECUTIVE OFFICERS AND CORPORATE GOVERNANCE
The information required by this Item regarding directors and executive officers is incorporated herein by reference to
our definitive Proxy Statement to be filed with the SEC in connection with the Annual Meeting of Shareholders to be held
in 2026 (the “Proxy Statement”).
We have adopted a code of ethics that applies to our principal executive officer, principal financial officer, principal
accounting officer, and controller. A copy of our Code of Conduct that applies to all our employees including our principal
executive officer, principal financial officer, principal accounting officer, and controller and other persons performing
similar functions is available on our website at www.ryanspecialty.com. Any substantive amendments to or waivers from
the Code of Conduct (to the extent applicable to our Chief Executive Officer, Chief Financial Officer or officers
responsible for financial reporting) will be disclosed on the Company’s website. We will provide a copy of the Code of
Conduct without charge upon written request to the Company’s Corporate Secretary, 155 North Wacker Drive, Suite 4000,
Chicago, IL 60606.
ITEM 11. EXECUTIVE COMPENSATION
The information required by this Item regarding director and executive officer compensation and compensation
committee interlocks and insider participation is incorporated herein by reference to our Proxy Statement.
The material incorporated herein by reference to the information set forth under the heading “Compensation
Committee Report” in the Proxy Statement shall be deemed furnished, and not filed, in this Form 10-K and shall not be
deemed incorporated by reference into any filing under the Securities Act or the Exchange Act as a result of this furnishing,
except to the extent that it is specifically incorporated by reference by Ryan Specialty.
ITEM 12. SECURITY OWNERSHIP OF CERTAIN BENEFICIAL OWNERS AND MANAGEMENT AND
RELATED STOCKHOLDER MATTERS
The information regarding equity compensation plans and the security ownership of certain beneficial owners and
management of Ryan Specialty’s common stock is incorporated herein by reference to our Proxy Statement.
ITEM 13. CERTAIN RELATIONSHIPS AND RELATED TRANSACTIONS, AND DIRECTOR
INDEPENDENCE
The information required by this Item regarding certain relationships and related transactions, and director
independence is incorporated herein by reference to our Proxy Statement.
ITEM 14. PRINCIPAL ACCOUNTANT FEES AND SERVICES
The Information required by this Item regarding fees billed to us by our principal accountant, Deloitte & Touche LLP
(PCAOB ID No. 34) and other matters is incorporated herein by reference to our Proxy Statement.
133
PART IV
ITEM 15. EXHIBITS AND FINANCIAL STATEMENT SCHEDULES
(a)(1) and (2).
The following documents have been included in Part II, Item 8.
•Report of Deloitte & Touche LLP Independent Registered Public Accounting Firm, on Financial Statements
•Consolidated Statements of Income for the years ended December 31, 2025, 2024, and 2023
•Consolidated Statements of Comprehensive Income for the years ended December 31, 2025, 2024, and 2023
•Consolidated Balance Sheets as of December 31, 2025 and 2024
•Consolidated Statements of Cash Flows for the years ended December 31, 2025, 2024, and 2023
•Consolidated Statements of Stockholders’ Equity for the years ended December 31, 2025, 2024 and 2023
•Notes to Consolidated Financial Statements
All schedules are omitted because the required information is either inapplicable or presented within the consolidated
financial statements or related notes.
(a)(3).
List of Exhibits (numbered in accordance with Item 601 of Regulation S-K)
Exhibit Number | Description | ||
3.1 | |||
3.2 | |||
4.1 | |||
4.2 | |||
4.3 | |||
4.4 | |||
4.5 | |||
4.6 | |||
4.7 | Description of Capital Stock, filed herewith. | ||
10.1 |
134
10.2 | |||
10.3 | + | ||
10.4 | + | ||
10.5 | |||
10.6 | + | ||
10.7 | + | ||
10.8 | + | ||
10.9 | + | ||
10.1 | + | ||
10.11 | + | ||
10.12 | + | ||
10.13 | + | ||
10.14 | + | ||
10.15 | + | ||
10.16 | |||
10.17 | |||
10.18 | |||
10.19 | + | ||
19.1 | |||
135
21.1 | Subsidiaries of the Registrant, filed herewith. | ||
23.1 | Consent of Deloitte & Touche LLP, filed herewith. | ||
31.1 | Certification of the Chief Executive Officer pursuant to Exchange Act Rule 13a-14(a), as adopted pursuant to Section 302 of the Sarbanes-Oxley Act of 2002, filed herewith. | ||
31.2 | Certification of the Chief Financial Officer pursuant to Exchange Act Rule 13a-14(a), as adopted pursuant to Section 302 of the Sarbanes-Oxley Act of 2002, filed herewith. | ||
32.1 | * | Certification of the Chief Executive Officer pursuant to 18 U.S.C. Section 1350, furnished herewith. | |
32.2 | * | Certification of the Chief Financial Officer pursuant to 18 U.S.C. Section 1350, furnished herewith. | |
97.1 | |||
101.INS | Inline XBRL (Extensible Business Reporting Language) Instance Document – the instance document does not appear in the Interactive Data File because its XBRL tags are embedded within the Inline XBRL document. | ||
101.SCH | Inline XBRL Taxonomy Extension Schema With Embedded Linkbase Documents | ||
104 | Cover Page Interactive Data File (formatted as Inline XBRL and contained in Exhibit 101) |
* The certifications furnished in Exhibit 32.1 and Exhibit 32.2 hereto are to be deemed “furnished” with this Annual
Report on Form 10-K and will not be deemed “filed” for purposes of Section 18 of the Exchange Act, except to the
extent that the registrant specifically incorporates it by reference.
+ Management contract or compensatory plan or arrangement
ITEM 16. FORM 10-K SUMMARY
None
SIGNATURES
Pursuant to the requirements of Section 13 or 15(d) of the Securities Exchange Act of 1934, the registrant has duly
caused this report to be signed on its behalf by the undersigned, thereunto duly authorized.
Date February 12, 2026 | |||
Ryan Specialty Holding, Inc | |||
By: | /s/ Timothy W. Turner | ||
Timothy W. Turner, Chief Executive Officer | |||
Pursuant to the requirements of the Securities Exchange Act of 1934, this report has been signed below by the
following persons on behalf of the registrant and in the capacities and on the dates indicated.
Signature | Title | Date |
/s/ Patrick G. Ryan | Executive Chairman and Chairman of the Board of Director | February 12, 2026 |
Patrick G. Ryan | ||
/s/ Timothy W. Turner | Chief Executive Officer and Director (Principal Executive Officer) | February 12, 2026 |
Timothy W. Turner | ||
/s/ Janice M. Hamilton | Executive Vice President and Chief Financial Officer (Principal Financial Officer and Principal Accounting Officer) | February 12, 2026 |
Janice M. Hamilton | ||
/s/ Henry S. Bienen | Director | February 12, 2026 |
Henry S. Bienen | ||
/s/ David P. Bolger | Director | February 12, 2026 |
David P. Bolger | ||
/s/ Michael G Bungert | Director | February 12, 2026 |
Michael G. Bungert | ||
/s/ Michelle L. Collins | Director | February 12, 2026 |
Michelle L. Collins | ||
/s/ Francesca Cornelli | Director | February 12, 2026 |
Francesca Cornelli | ||
/s/ Nicholas D. Cortezi | Director | February 12, 2026 |
Nicholas D. Cortezi | ||
/s/ Anthony J. Kuczinski | Director | February 12, 2026 |
Anthony J. Kuczinski | ||
/s/ Michael D. O’Halleran | Director | February 12, 2026 |
Michael D. O’Halleran | ||
/s/ John W. Rogers, Jr | Director | February 12, 2026 |
John W. Rogers, Jr | ||
/s/ Patrick G. Ryan, Jr. | Director | February 12, 2026 |
Patrick G. Ryan, Jr. |
[Signature Page to 10-K]